

Updated
- $23.9B
- Total value of household electricity usage in 2024–25
- $3,357
- Highest state standing-offer benchmark: South Australia at 6,500 kWh (July 2026)
- $2,187
- Lowest state standing-offer benchmark: Tasmania at 6,500 kWh (July 2026)
- 2×
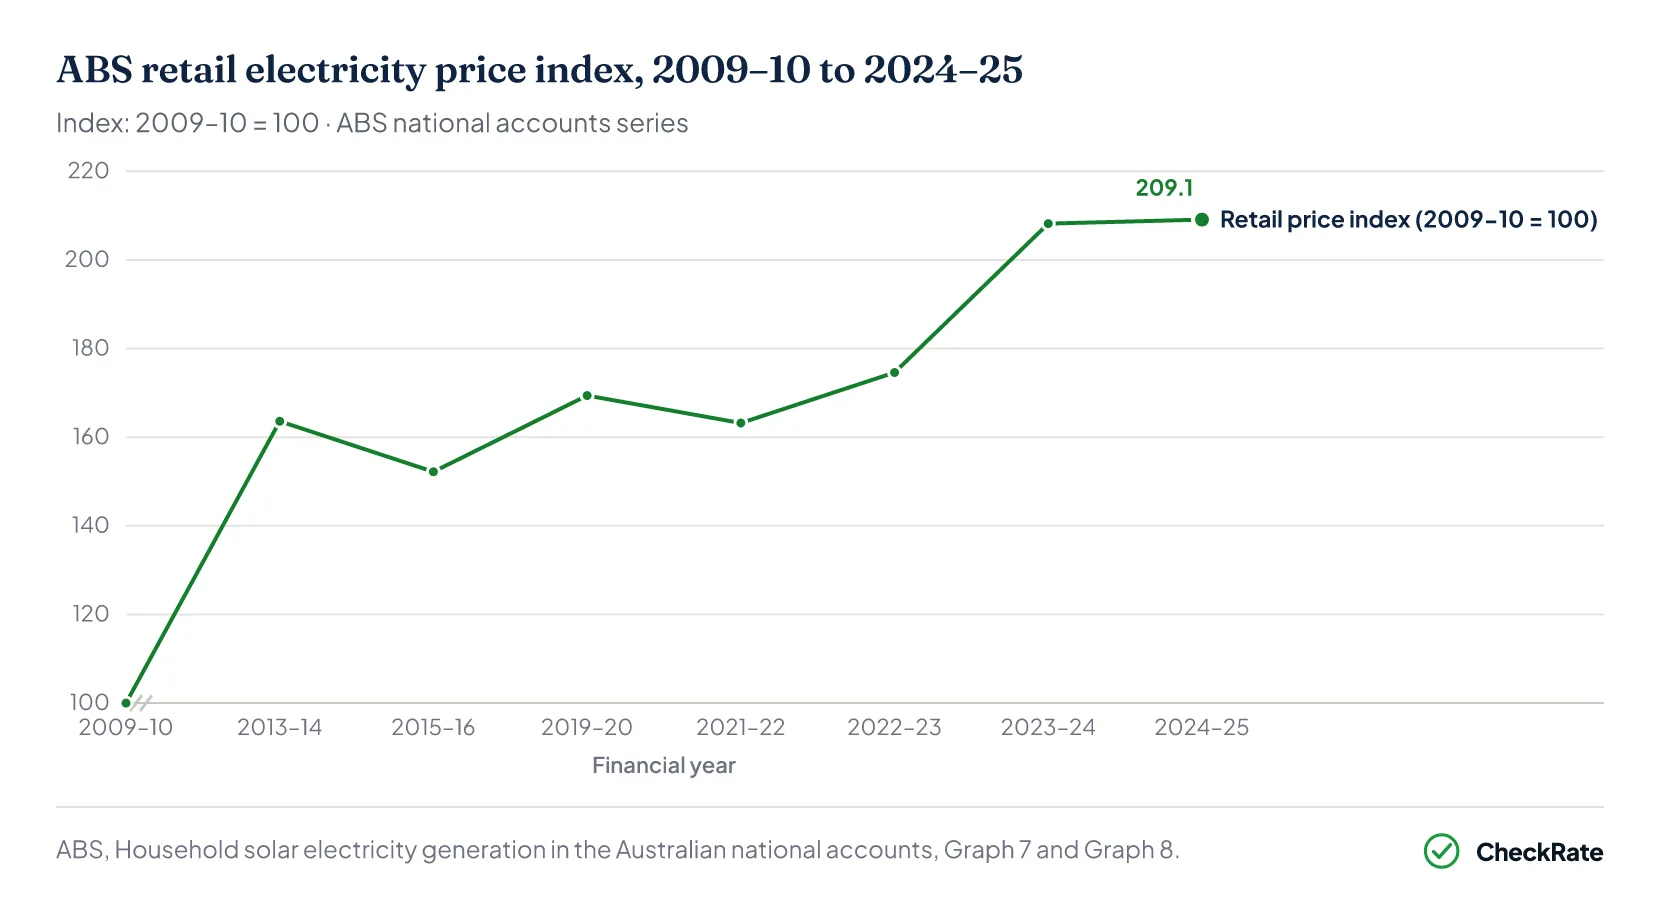
- Retail electricity prices have doubled since 2009–10 in ABS national accounts
 Cost of living in Australia: what households spent in 2025Australian households spent a combined $923 billion across tracked consumer categories in 2025, up 52% from $606 billion in 2016. When housing costs are included, the average household is estimated to…
 Average grocery bill in Australia: what households spendThe average Australian household spends $178 a week on groceries in 2025, up from $168 in 2024 and $160 in 2023. Over three years, that is an $18 rise at the checkout, or roughly $936 more a year.
 Average rent in Australia 2026: rent by state and cityAustralian rent inflation eased to 3.8% year-on-year in February 2026, down from a peak of 7.8% in August 2023. The pace of rent growth has roughly halved over the past 30 months, although rents thems…
Section 01 · What Australians pay overall
How much Australian households spend on electricity
Australian household electricity usage was valued at $23.9 billion in 2024–25, up from $11.674 billion in 2009–10. That represents an increase of around 105% in nominal terms over 15 years.
Of that $23.9 billion, households paid $17.752 billion directly to retailers, governments covered a further $5.368 billion through rebates, and $798.8 million was attributed to household solar electricity consumed at home. The national average retail rate was approximately $0.29 per kWh, also around twice the 2009–10 level.
In the 12 months to April 2026, the electricity CPI rose 22.5%, primarily because government rebates that had reduced bills in 2024–25 came to an end. Excluding that rebate effect, underlying prices rose 3.1%, reflecting annual retailer reviews in July 2025.
$23.9B
Total value of household electricity usage in 2024–25 Households paid $17.752 billion directly to retailers, governments covered a further $5.368 billion through rebates, and $798.8 million was attributed to household solar consumed at home. The national average retail rate was $0.29/kWh, double the 2009–10 level.
What is the most current official measure of what Australian households spend on electricity?
The most current official measure is the 2024–25 national-accounts figure, which valued Australian household electricity usage at $23.9 billion. This includes electricity paid for directly by households, government rebates and household solar consumed at home. The latest survey-based per-household electricity spending figure is older: $30 per week from the ABS Household Expenditure Survey in 2015–16. It has not been updated since.
Section 02 · How much does location matter?
How much do electricity bills vary by state?
CUSTOMER TYPE
Residential, on a standing offer
Not a switched market offer
USAGE ASSUMED
6,500 kWh per year
A benchmark usage level for comparison
WHAT IT IS NOT
Not a survey of what households paid
Not an average bill across all households
Using this benchmark, a South Australian household on a standing offer pays around $3,357 a year, or about $280 a month and $65 a week. A Tasmanian household using the same amount pays $2,187 a year, or about $182 a month and $42 a week. The $1,170 annual gap works out to about $22 a week more in South Australia, based on identical usage under the same plan type.
Usage above or below 6,500 kWh, concessions, solar and market offers will change the final bill.
The final determinations were released on 26 May 2026 and apply from 1 July 2026. Under these changes, NSW standing-offer benchmarks fall by 3.4% to 5.0%, south-east Queensland falls by 7.2%, and Victoria falls by 5.0%. South Australia rises by 1.4%, and the ACT rises by 2.73%
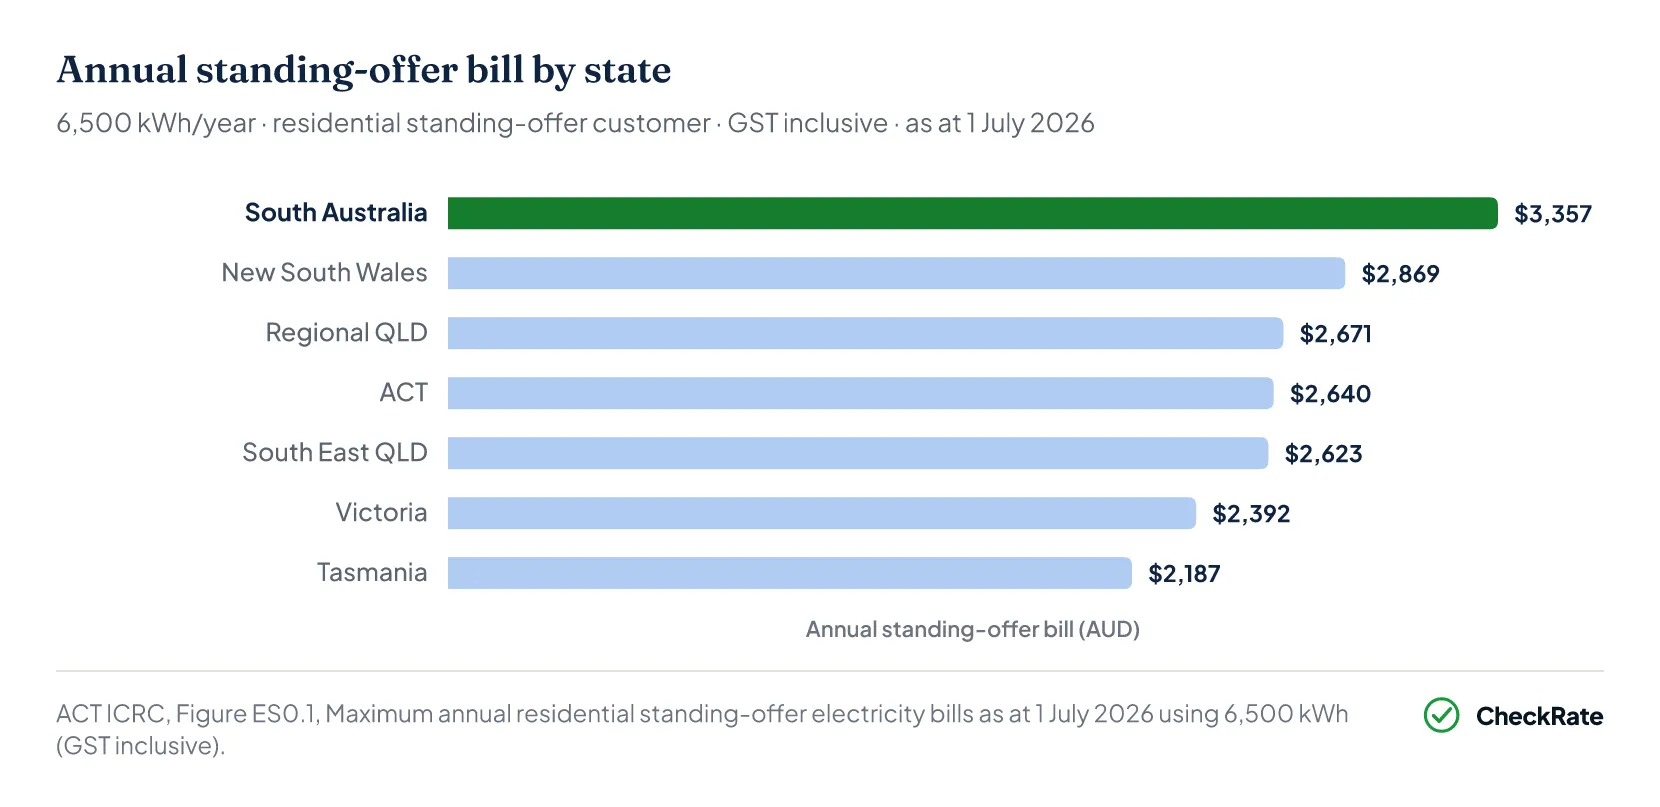
- South Australia
- $3,357
- New South Wales
- $2,869
- Regional QLD
- $2,671
- Australian Capital Territory
- $2,640
- South East QLD
- $2,623
- Victoria
- $2,392
- Tasmania
- $2,187
- WA
- $2,797
- NT
- $2,412
- South Australia
- $280
- New South Wales
- $239
- Regional QLD
- $223
- Australian Capital Territory
- $220
- South East QLD
- $219
- Victoria
- $199
- Tasmania
- $182
- WA
- $233
- NT
- $201
- South Australia
- $65
- New South Wales
- $55
- Regional QLD
- $51
- Australian Capital Territory
- $51
- South East QLD
- $50
- Victoria
- $46
- Tasmania
- $42
- WA
- $54
- NT
- $46
| State-by-state: what standing-offer customers pay | |||||
|---|---|---|---|---|---|
| State or region | Per year | Per month | Per week | Change from 1 July 2026 | From 1 July 2026 |
| South Australia | $3,357 | $280 | $65 | ↑ +1.4% | $2,334/yr from Jul 2026 |
| New South Wales | $2,869 | $239 | $55 | ↓ −3.4 to −5.0% | $1,899–$2,604 (by zone) |
| Regional QLD | $2,671 | $223 | $51 | — | Ergon Energy tariffs |
| ACT | $2,640 | $220 | $51 | ↑ +2.73% | Regulated tariff +2.73% |
| South East QLD | $2,623 | $219 | $50 | ↓ −7.2% | $1,988/yr from Jul 2026 |
| Victoria | $2,392 | $199 | $46 | ↓ −5.0% | $1,591/yr from Jul 2026 |
| Tasmania | $2,187 | $182 | $42 | — | Aurora standing offer |
| Western Australia † | $2,797 | $233 | $54 | — | Synergy state tariffs |
| Northern Territory † | $2,412 | $201 | $46 | — | Jacana Energy tariffs |
Source · ACT ICRC, Figure ES0.1, as at 1 July 2026. Tasmanian Economic Regulator, November 2025.
How network charges affect electricity bills
One major factor is network charges, which cover poles, wires and metering. These charges make up 39% to 54% of the standing-offer reference price, depending on the region. They are set by regulators, not retailers, so switching plans does not remove this part of the bill. Network tariff estimates increased for most customers in 2025–26.
Each state also runs a different pricing framework. NSW, south-east Queensland and South Australia use the AER's Default Market Offer. Victoria has its own Victorian Default Offer. The ACT has a regulated standing offer set by the ICRC. Western Australia uses state-approved tariffs. As a result, the same household using the same amount of electricity can face a structurally different bill depending on where it lives.
What does the $1,170 gap between South Australia and Tasmania actually mean for a household?
A South Australian household on a standing offer using 6,500 kWh a year pays $3,357. A Tasmanian household using the same amount pays $2,187. The difference is $1,170 a year, or about $22 a week and $97 a month, on the same usage and plan type. Both figures are standing-offer benchmarks. Households on market offers, concessions or solar may pay different amounts.
How much of an electricity bill is made up of network costs?
Network charges, covering poles, wires and metering, make up 39% to 54% of the standing-offer reference price in AER regions. The exact share varies by distributor and tariff type. Switching retailer may reduce the retail part of a bill, but it does not remove regulated network charges.
Section 03 · Electricity use by household size and location
Electricity use rises with household size and colder climates
Household size is one of the main drivers of electricity consumption in the AER benchmark framework. A one-person household in Sydney uses around 3,109 kWh a year. A four-person household in the same area uses around 7,311 kWh, more than double.
The AER benchmarks are based on household size and climate zone; they do not publish separate electricity-use figures by dwelling type.
Climate zone is also a significant factor. A two-person household uses 4,840 kWh a year in Melbourne, which is Climate Zone 6, compared with 8,784 kWh in Tasmania, which is Climate Zone 7. That is an 82% difference and may reflect higher heating demand in colder months.
AER benchmarks show annual grid electricity use across representative locations, household sizes and climate zones.
Consumption by household size and location
The table below shows annual electricity consumption benchmarks across representative locations and household sizes. These figures come from the AER's December 2020 benchmark report and are the most detailed official breakdown available at this level.
| Annual electricity consumption by household size and climate zone · kWh/year | |||||
|---|---|---|---|---|---|
| Location | Climate zone | 1 person | 2 people | 3 people | 4 people |
| Brisbane / Gold Coast | Zone 2 (QLD) | 3,412 | 5,126 | 6,169 | 7,682 |
| Sydney / NSW Climate Zone 5 | Zone 5 (NSW) | 3,109 | 5,237 | 6,361 | 7,311 |
| Melbourne | Zone 6 (VIC) | 2,953 | 4,840 | 5,077 | 5,805 |
| Canberra / ACT | Zone 7 (ACT) | 4,360 | 6,107 | 7,722 | 9,542 |
| Tasmania | Zone 7 (TAS) | 6,003 | 8,784 | 9,475 | 10,820 |
Source · AER, Residential Energy Consumption Benchmarks, December 2020 (Frontier Economics), Tables 13–18.
What the data shows about dwelling type
The AER benchmarks do not publish separate figures for houses and apartments. The data is stratified by household size and climate zone only. A 1-person household in Sydney uses around 3,109 kWh a year, while a 4-person household in the same area uses around 7,311 kWh. The 135% difference reflects the number of occupants, not the building type. The benchmark data does not distinguish between a 4-person apartment and a 4-person house in the same climate zone.
Climate zone is also a major driver. A 2-person household in Tasmania uses 8,784 kWh a year, substantially more than a 4-person household in Melbourne, at 5,805 kWh a year. This comparison reflects climate zone and household size differences, not dwelling type.
Why do the AER benchmarks not break down by dwelling type?
The 2020 benchmarks were developed under the former National Energy Retail Rules framework, which required them to be based on household size and localised climate zones, not dwelling structure. The AER's obligation to develop and update electricity consumption benchmarks, and the retailer requirement to display them on bills, were both removed in 2023. The benchmark framework used location and household-size categories as its main variables. Dwelling type was collected in the underlying survey, but the published benchmark tables were not stratified by dwelling type.
Why does Tasmania use so much more electricity than Melbourne?
Tasmania sits within Climate Zone 7 in the AER benchmark data, where colder winters are associated with higher electricity use for heating. A 2-person Tasmanian household uses 2,950 kWh in winter, compared with 1,581 kWh in summer. Melbourne sits in Climate Zone 6, which has milder winters and higher mains gas use in the benchmark context, reducing benchmark electricity consumption compared with colder, more electricity-dependent areas. The AER benchmarks show that Climate Zone 7 households consume 7,229 kWh a year on average, 46% more than the 4,953 kWh average in Climate Zone 6.
Section 04 · When the bill peaks
When are electricity bills highest in Australia?
Electricity bills are usually highest in summer in warmer climates and in winter in colder climates. Electricity prices rose by 22.5% in the 12 months to April 2026, primarily because government rebates that had reduced bills in 2024–25 ended. Excluding that rebate effect, underlying prices rose 3.1%, reflecting annual retailer reviews in July 2025.
No official source publishes a national table of household electricity bills by season. However, the AER's climate zone consumption benchmarks show when electricity use peaks across different parts of Australia.
- Warm climates (Brisbane, Gold Coast): Summer is the peak season. Air conditioning drives the highest electricity consumption in these zones.
- Cold climates (ACT, Tasmania, alpine NSW and VIC): Winter is the peak season. Climate Zone 7 records the highest total electricity consumption of any zone in Australia.
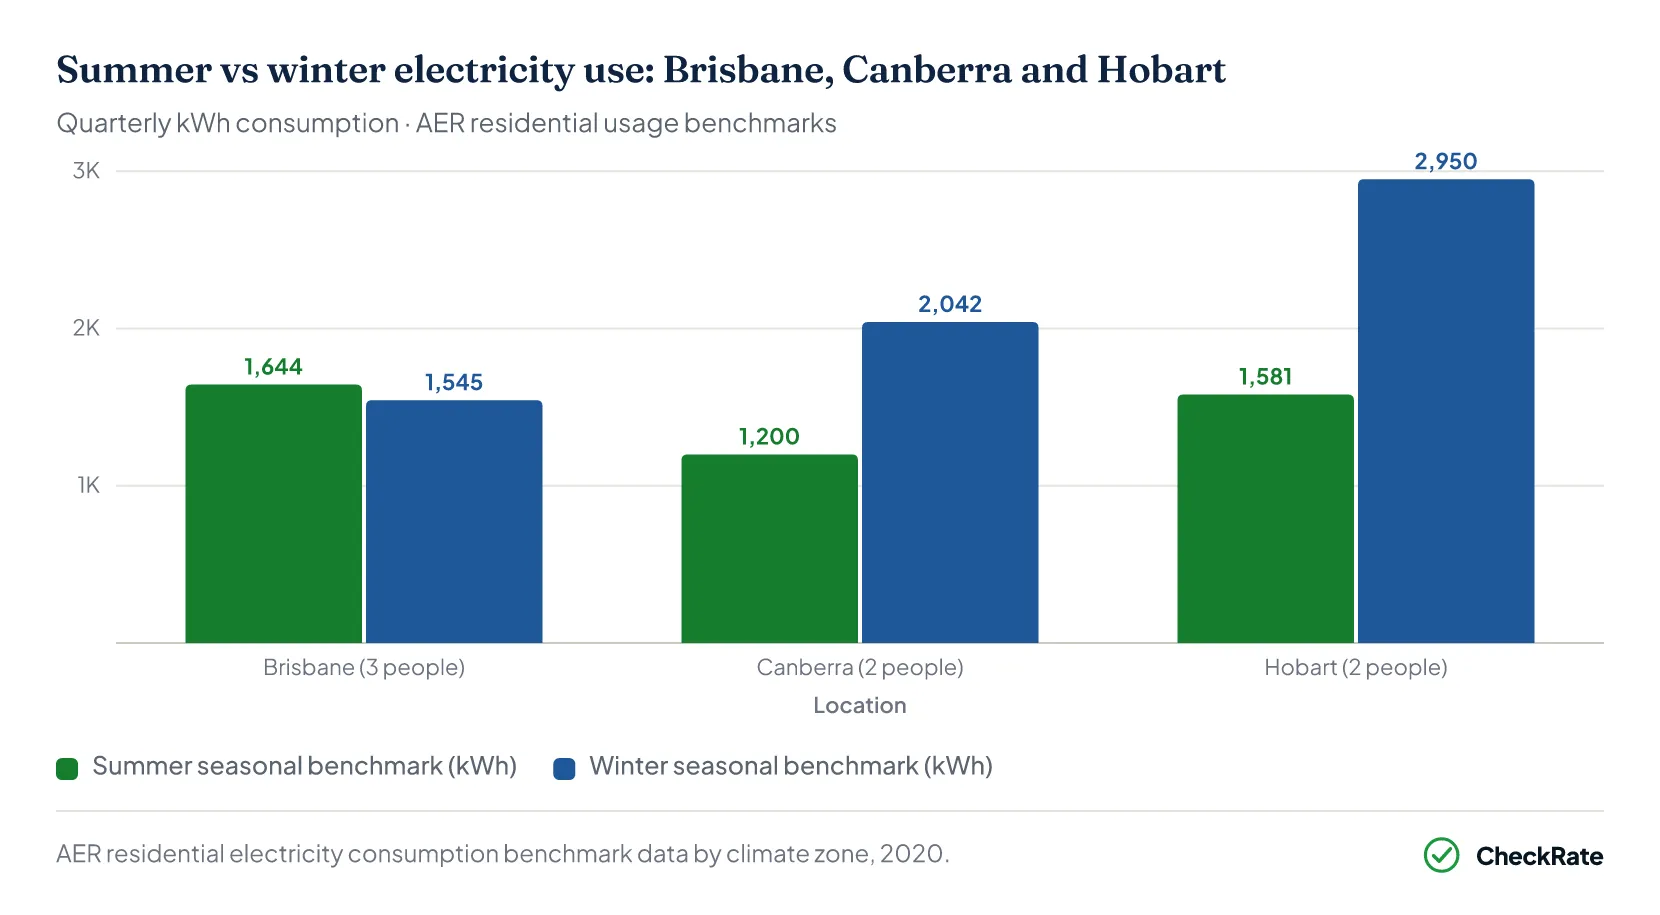
According to AER residential benchmark data, a two-person Hobart household uses an estimated 2,950 kWh in winter, compared with 1,581 kWh in summer. In Canberra, a two-person household uses 2,042 kWh in winter, about 70% higher than its summer figure of 1,200 kWh.
+$359
Per winter quarter · Hobart
Hobart's winter electricity premium A two-person Hobart household uses 2,950 kWh in winter, compared with 1,581 kWh in summer. That is a seasonal gap of 1,369 kWh. At an assumed usage rate of 26.2c/kWh, the difference is worth about $359 more in the winter quarter.
Summer electricity use peaks in warm climates
For households in Queensland and warmer parts of NSW, summer is the peak season for electricity use. Air conditioning is the key driver of higher summer consumption in these areas. Spring and autumn are typically the lowest-consumption seasons in warm climates.
Winter electricity use can nearly double in cold climates
For Tasmanians, ACT residents and those in alpine or inland southern regions, winter is the highest-consumption season by a significant margin. A two-person Hobart household's winter consumption of 2,950 kWh is 87% higher than its summer figure, with heating likely to be a major factor.
Time-of-use tariffs can widen seasonal bill differences
Where time-of-use tariffs apply, the seasonal difference in bills can widen further. Households with heavy evening loads such as air conditioning, EV charging, electric heating or cooking may face higher bills if more of their usage falls during peak-priced periods. The key variable is not just how much electricity a household uses, but when it uses it.
Section 05 · Affordability and financial pressure
How electricity bills affect household budgets
Electricity costs take up a larger share of income for low-income households than for average-income households. As at 31 March 2025, after eligible concessions and rebates, low-income households spent 1.8% to 5.1% of income on electricity, compared with 1.0% to 2.7% for average-income households. This shows how electricity costs can fall unevenly across the income distribution.
On a broader spending basis, domestic fuel and power costs averaged $41 per week in the ABS Household Expenditure Survey 2015–16. This represented 2.9% of average weekly household spending. The ABS data is older than the AER income-share figures, but it provides a broad household spending benchmark.
The AER's State of the Energy Market 2025 also points to wider financial pressure among energy customers. In AER-commissioned research, 37% of surveyed energy customers were experiencing financial stress, and more than a third of financially stressed customers had been unable to pay an energy or water bill on time in the previous 12 months.
Australian Energy Regulator, State of the Energy Market 2025, Chapter 6, customer debt and hardship data, 12 months to 31 March 2025.
$305M
Estimated total energy debt
Australia's outstanding residential energy debt, March 2025 With 215,637 residential customers carrying an average balance of $1,415, estimated outstanding residential energy debt was approximately $305 million as at 31 March 2025. The average balance rose 27.9%, from $1,106 a year earlier.
As at 31 March 2025, 3.1% of residential customers had outstanding energy debt. The average balance per indebted customer rose from $1,106 to $1,415 over the same period.
Disconnection rates remain below pre-COVID levels, but energy debt and partial payments can continue to build for customers already in arrears.
Government rebates
Several rebates reduced out-of-pocket electricity costs in 2024–25, although they did not change underlying electricity tariffs. These include:
- Commonwealth Energy Bill Relief Fund: up to $300 in 2024–25, then a further $150 from 1 July 2025
- Queensland: additional $1,000 cost-of-living rebate in 2024–25
- Western Australia: separate $400 household rebate in 2024–25
Renters, older households and younger households
Electricity bill pressure does not fall evenly across households. Age, tenure, income, eligibility for concessions and access to solar or efficient appliances all affect how much a household pays relative to its income.
- Older households may report lower bills in some datasets, partly due to concessions, smaller household sizes and higher rates of rooftop solar ownership.
- Younger renters may have less access to efficiency upgrades, solar or batteries, and less control over insulation or heating systems.
- Renters may also live in embedded networks, which can limit access to competitive retail offers.
Combined with generally lower incomes, younger renters may be more exposed to electricity bill pressure than national averages suggest.
What is the estimated total value of outstanding residential energy debt in Australia?
With 215,637 residential customers carrying an average outstanding balance of $1,415 as at March 2025, estimated outstanding residential energy debt across Australia was approximately $305 million. The share of customers in debt was 3.1% as at 31 March 2025.
By how much has average energy debt per customer grown in one year?
The average outstanding balance per customer in arrears rose from $1,106 to $1,415 in a single year, an increase of $309 or 27.9%. Over the same period, the share of residential customers with outstanding debt also increased to 3.1%.
References
- Household solar electricity generation in the Australian national accounts, 2024-25 · Australian Bureau of Statistics
- ABS Consumer Price Index, Australia (latest release, Cat. 6401.0) · Australian Bureau of Statistics
- ABS, Household Expenditure Survey, Australia: Summary of Results, 2015–16 · Australian Bureau of Statistics
- ICRC, Retail electricity price recalibration 2026–27, May 2026 · icrc.act.gov.au
- Tasmanian Economic Regulator, Comparison of electricity and gas prices available to small customers in Australia 2025, November 2025 · economicregulator.tas.gov.au
- AER, Default Market Offer 2026–27 Final Determination, 26 May 2026 · Australian Energy Regulator
- Essential Services Commission Victoria, Victorian Default Offer price review 2026–27 · esc.vic.gov.au
- AER, State of the Energy Market 2025 — Chapter 6: Retail energy markets and energy consumers · Australian Energy Regulator
- AER, Annual retail markets report 2024–25, 30 November 2025 · Australian Energy Regulator
- AER, Residential Energy Consumption Benchmarks, December 2020 (Frontier Economics) · Australian Energy Regulator
Methodology note: This article uses only official ABS, AER, state regulator and ACT ICRC sources. No commercial consumer surveys are cited. Standing-offer price figures are based on regulated tariffs and fixed annual usage assumptions. They are not survey-based averages of what all households paid. AER consumption benchmarks are separate usage benchmarks based on household size and climate zone, and measure grid electricity consumption rather than household bills. The most recent official survey-based national household electricity spending figure is from the ABS Household Expenditure Survey 2015–16. A current official state-by-state electricity-only average bill series was not identified in the reviewed sources. The NT is excluded from AER and ICRC standing-offer comparisons because it is outside the National Electricity Market.