


Published
Section 01 · 2024-25 headline
What share of Australian businesses sought and did not obtain finance in 2024-25?
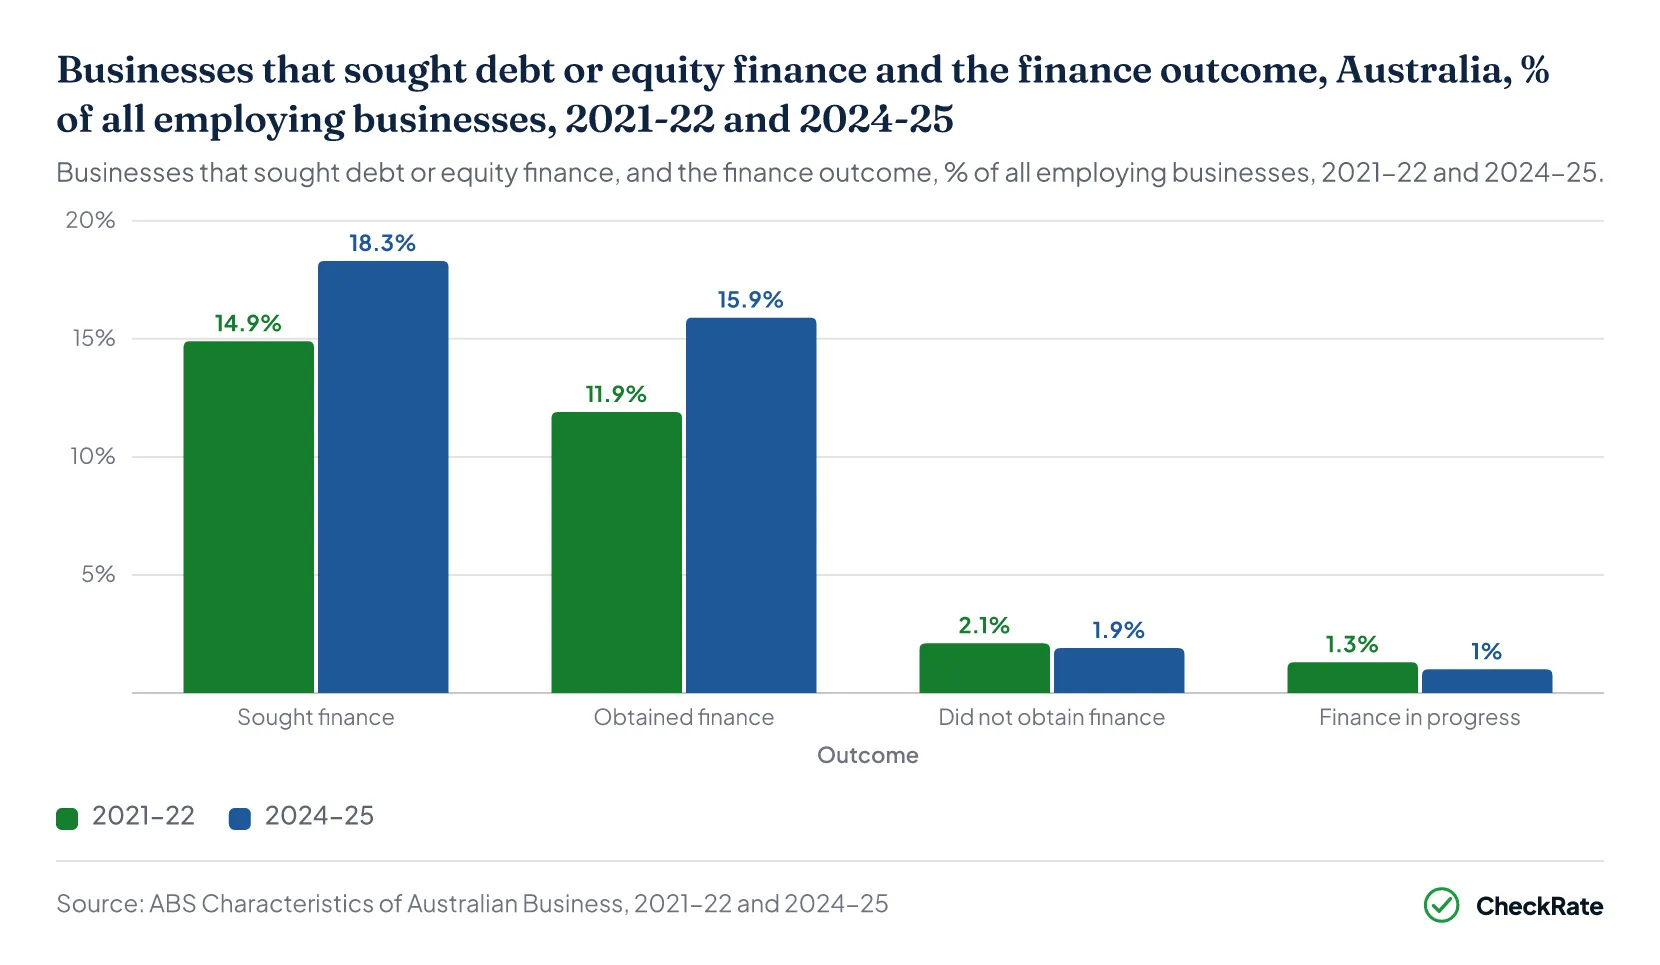
Businesses that sought debt or equity finance and did not obtain it made up 1.9% of all employing businesses in Australia in 2024-25, according to the Australian Bureau of Statistics (ABS)1. Businesses that sought finance made up 18.3% of all employing businesses, and businesses that obtained finance made up 15.9%. A further 1.0% of employing businesses had finance in progress at the end of the year.
Among businesses that sought finance, 10.4% did not obtain it, 86.9% obtained it and 5.5% had finance in progress1.
The three outcome shares add to 18.8% of employing businesses, above the 18.3% that sought finance1. As the published figures do not reconcile, the outcome shares are separate estimates rather than components that add to the total share seeking finance.
Debt finance is any finance the business must repay, and equity finance is finance provided in exchange for a share in the ownership of the business2. The ABS collects the data from employing businesses and excludes public administration and safety, education and training, superannuation funds and general government.
No official statistic counts business loan applications or rejections, and the ABS measure covers debt or equity finance of any kind rather than loans alone2.
| Businesses that sought debt or equity finance and the outcome, Australia, %, 2024-25 | ||
|---|---|---|
| Outcome | Share of all employing businesses (%) | Share of businesses that sought finance (%) |
| Sought debt or equity finance | 18.3 | 100.0 |
| Obtained finance | 15.9 | 86.9 |
| Did not obtain finance | 1.9 | 10.4 |
| Finance in progress | 1.0 | 5.5 |
Source · ABS, Characteristics of Australian Business, 2024-25, Business finance and assistance, Table 2
Section 02 · By business size
Which business sizes were most likely not to obtain finance in 2024-25?
Businesses with 0 to 4 persons had the highest share of finance seekers that did not obtain finance among the four employment size groups in 2024-25, at 13.0%1. Businesses with 200 or more persons recorded the lowest share of finance seekers that did not obtain finance among the four groups, at 3.1%. The share was 9.6% for businesses with 5 to 19 persons and 3.4% for those with 20 to 199 persons.
The share of businesses that sought finance increased with business size, from 13.8% for businesses with 0 to 4 persons to 35.8% for those with 200 or more persons, according to the ABS1.
Across all employing businesses in each size group rather than only finance seekers, businesses with 5 to 19 persons recorded the highest share that did not obtain finance, at 2.4%1. The lowest share was 1.0% for businesses with 20 to 199 persons.
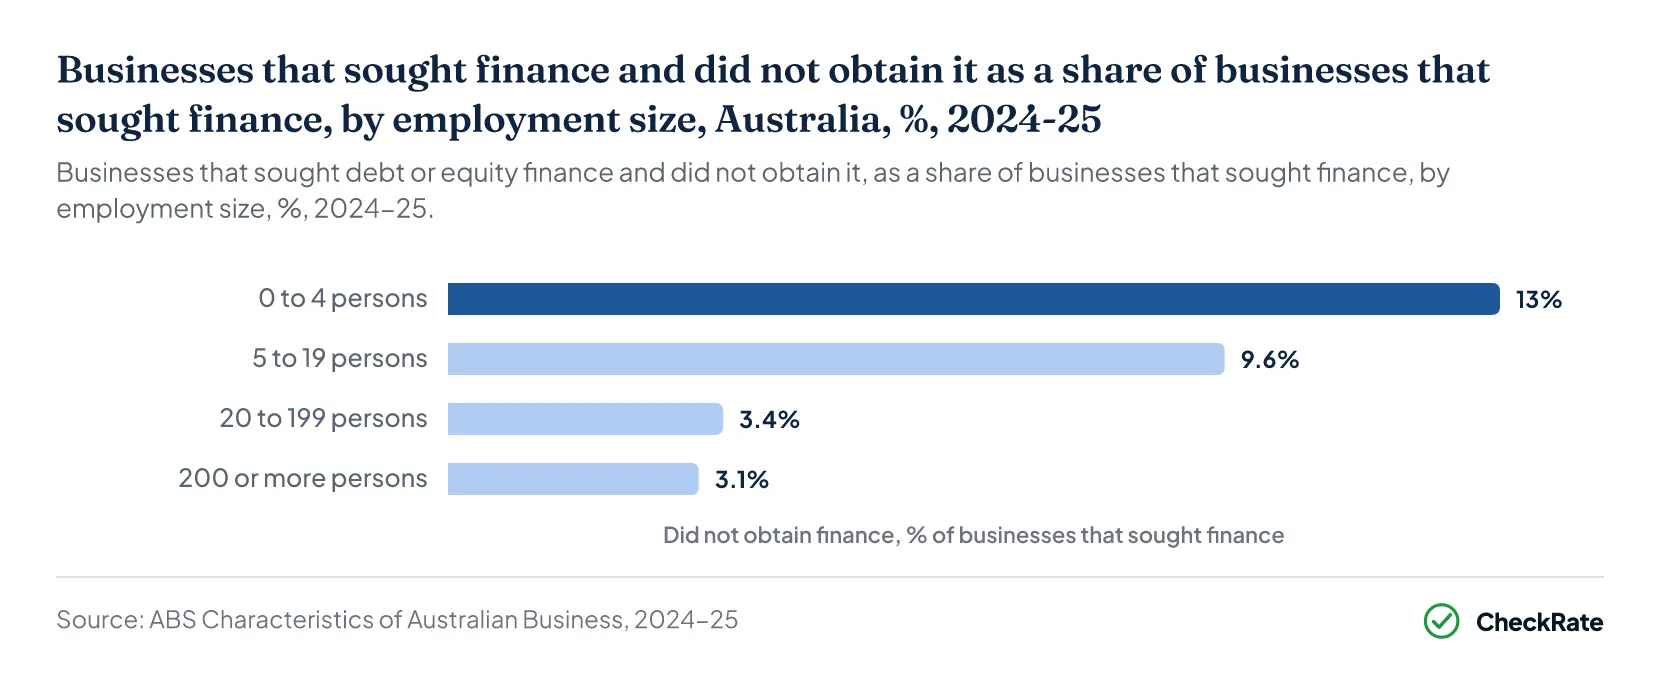
| Businesses that sought debt or equity finance and the outcome, by employment size, Australia, %, 2024-25 | |||||
|---|---|---|---|---|---|
| Employment size | Sought finance (% of all employing businesses) | Obtained (% of all employing businesses) | Not obtained (% of all employing businesses) | In progress (% of all employing businesses) | Not obtained (% of businesses that sought finance) |
| 0 to 4 persons | 13.8 | 11.6 | 1.8 | 1.0 | 13.0 |
| 5 to 19 persons | 25.0 | 21.8 | 2.4 | 1.2 | 9.6 |
| 20 to 199 persons | 29.3 | 27.9 | 1.0 | 1.2 | 3.4 |
| 200 or more persons | 35.8 | 34.0 | 1.1 | 1.4 | 3.1 |
| All businesses | 18.3 | 15.9 | 1.9 | 1.0 | 10.4 |
Source · ABS, Characteristics of Australian Business, 2024-25, Business finance and assistance, Table 2
Lending outstanding to small and medium businesses is set out in the SME lending statistics article.
Section 03 · By industry
Which industries had the highest share of finance seekers not obtaining finance in 2024-25?
Information media and telecommunications recorded the highest share of finance seekers that did not obtain finance in 2024-25, at 20.0%1. The ranking covers the 15 industry divisions with a published value. Professional, scientific and technical services was second at 18.5%, followed by arts and recreation services at 16.9%.
Agriculture, forestry and fishing recorded the lowest share of finance seekers that did not obtain finance among the 15 divisions, at 1.8%1.
Mining recorded the highest share of businesses that sought finance among the 17 industry divisions, at 35.1% of all employing businesses in the division1. Agriculture, forestry and fishing was second at 33.1%, while professional, scientific and technical services recorded the lowest share, at 10.8%.
Rental, hiring and real estate services recorded the highest share of businesses that did not obtain finance among the 15 divisions with a published value, at 3.3% of all employing businesses in the division1. Mining was next at 2.8%.
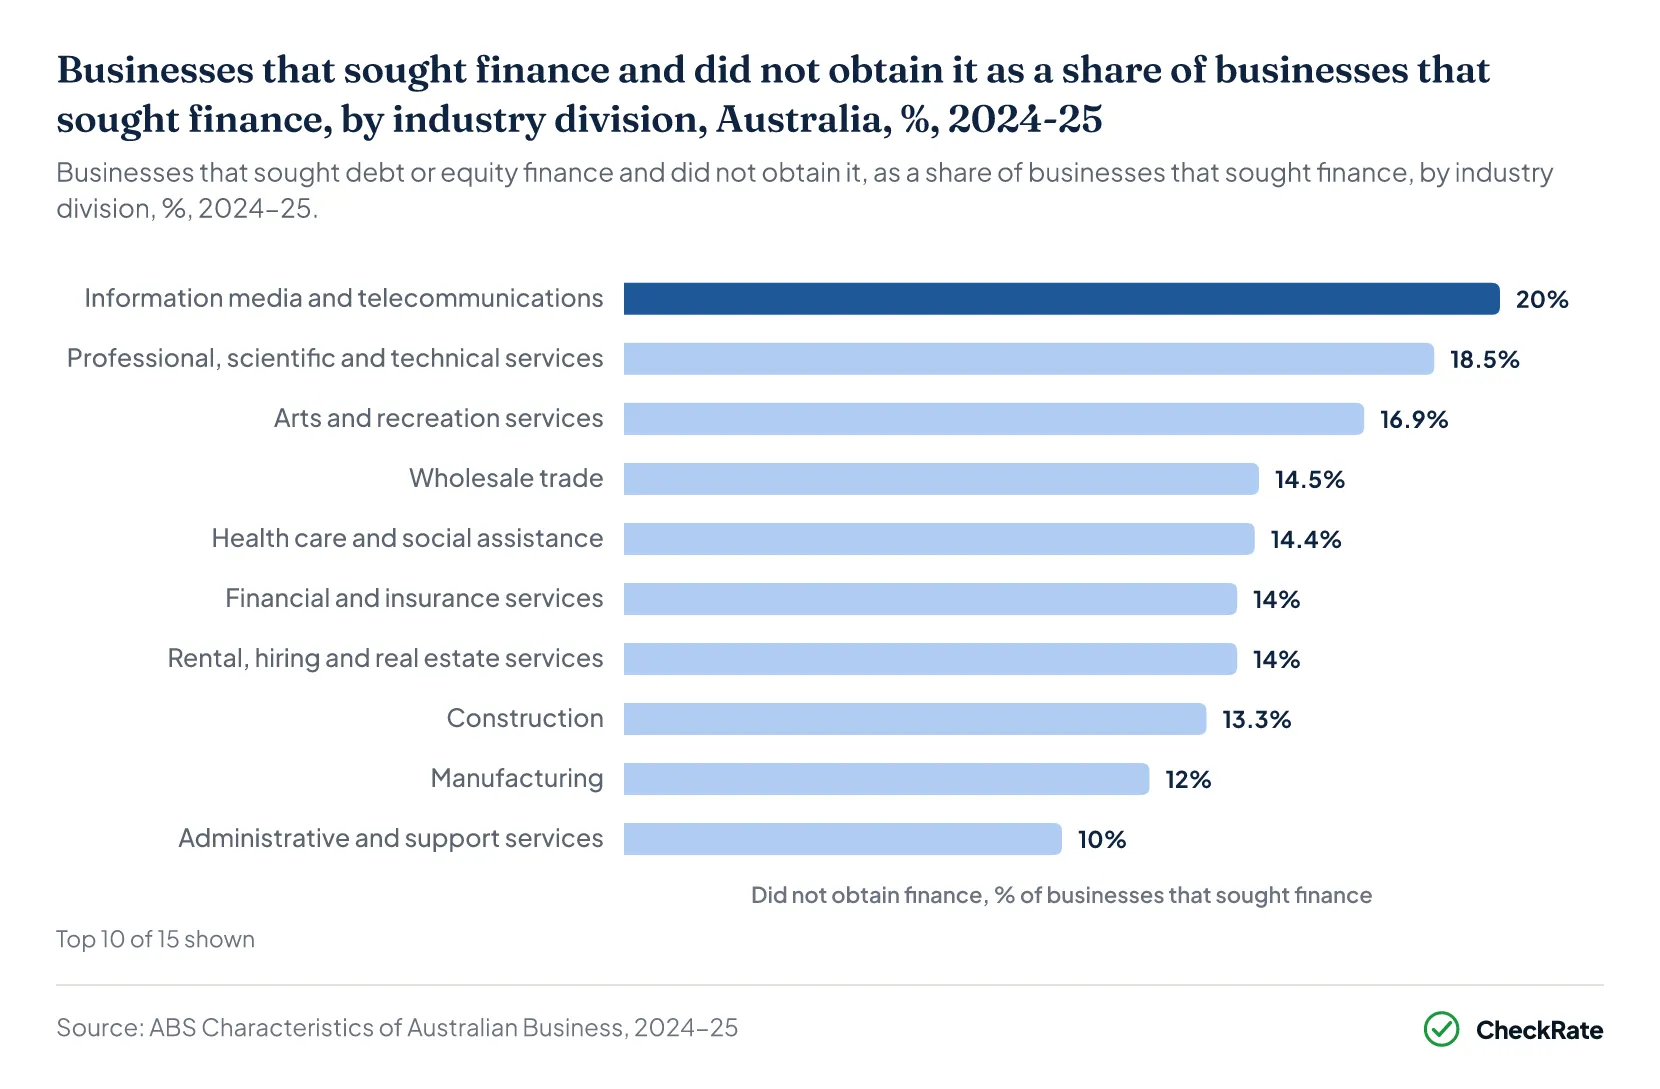
| Businesses that sought debt or equity finance and the outcome, by industry division, Australia, %, 2024-25 | |||||
|---|---|---|---|---|---|
| Industry | Sought finance (% of all employing businesses) | Obtained (% of all employing businesses) | Not obtained (% of all employing businesses) | In progress (% of all employing businesses) | Not obtained (% of businesses that sought finance) |
| Agriculture, forestry and fishing | 33.1 | 30.2 | 0.6 | 3.1 | 1.8 |
| Mining | 35.1 | 30.2 | 2.8 | 3.3 | 8.0 |
| Manufacturing | 20.8 | 18.2 | 2.5 | 1.1 | 12.0 |
| Electricity, gas, water and waste services | 25.1 | 24.3 | np | 1.3 | np |
| Construction | 18.0 | 15.5 | 2.4 | 1.2 | 13.3 |
| Wholesale trade | 17.9 | 15.0 | 2.6 | np | 14.5 |
| Retail trade | 23.3 | 21.4 | 1.0 | 1.6 | 4.3 |
| Accommodation and food services | 23.4 | 20.3 | 2.2 | 0.9 | 9.4 |
| Transport, postal and warehousing | 19.0 | 17.0 | np | 1.9 | np |
| Information media and telecommunications | 12.5 | 8.7 | 2.5 | 1.3 | 20.0 |
| Financial and insurance services | 17.8 | 14.8 | 2.5 | np | 14.0 |
| Rental, hiring and real estate services | 23.6 | 20.3 | 3.3 | 0.8 | 14.0 |
| Professional, scientific and technical services | 10.8 | 8.5 | 2.0 | 0.8 | 18.5 |
| Administrative and support services | 20.0 | 17.8 | 2.0 | 0.2 | 10.0 |
| Health care and social assistance | 11.8 | 9.4 | 1.7 | 0.6 | 14.4 |
| Arts and recreation services | 14.2 | 11.8 | 2.4 | 0.8 | 16.9 |
| Other services | 17.7 | 17.1 | 1.0 | 0.7 | 5.6 |
| All industries | 18.3 | 15.9 | 1.9 | 1.0 | 10.4 |
Source · ABS, Characteristics of Australian Business, 2024-25, Business finance and assistance, Table 2
Section 04 · By state and location
Which states and territories had the highest share of businesses seeking finance in 2024-25?
The Northern Territory recorded the highest share of businesses seeking finance among the eight states and territories in 2024-25, at 30.6% of employing businesses1. South Australia was second at 24.3%, while the Australian Capital Territory recorded the lowest at 13.6%.
In New South Wales, 16.8% of employing businesses sought finance, compared with 18.7% in Victoria and 18.9% in Queensland1.
The Australian Capital Territory recorded the highest estimated share of businesses that did not obtain finance, at 4.0% of employing businesses in the territory1. That is equivalent to 29.4% of businesses in the territory that sought finance. Western Australia recorded the lowest estimated share, at 0.3% of employing businesses in the state, equivalent to 1.7% of those that sought finance.
The state and territory figures are survey estimates2. The ABS annotates estimates with a relative standard error of 10% to less than 25% for use with caution, and none of the finance figures on this page carries the annotation1.
The ABS also groups businesses by where they operate, including capital city, metropolitan and regional locations1. Businesses located only in regional areas had a higher share seeking finance than those located only in a capital city, at 20.5% compared with 16.8%.
Among the four non-overlapping location categories, businesses operating only in a state or territory capital city CBD recorded the highest share that did not obtain finance, at 2.9% of all employing businesses in the category1.
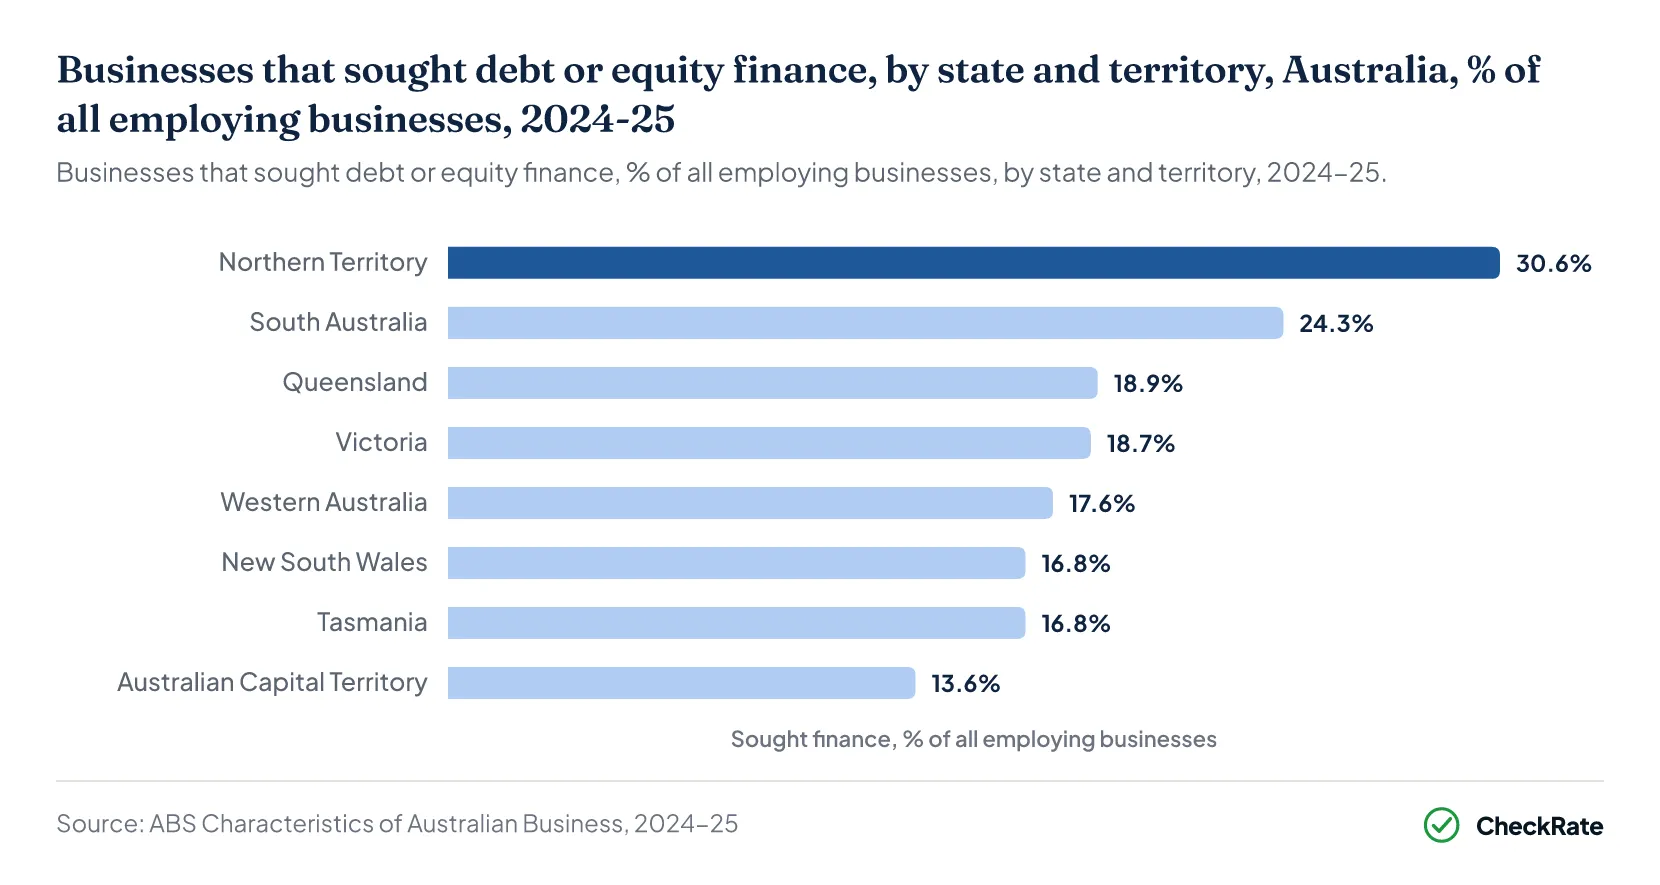
| Businesses that sought debt or equity finance and the outcome, by state and territory and by location, Australia, %, 2024-25 | |||||
|---|---|---|---|---|---|
| State, territory or location | Sought finance (% of all employing businesses) | Obtained (% of all employing businesses) | Not obtained (% of all employing businesses) | In progress (% of all employing businesses) | Not obtained (% of businesses that sought finance) |
| New South Wales | 16.8 | 14.5 | 2.0 | 0.9 | 11.9 |
| Victoria | 18.7 | 15.6 | 2.4 | 1.1 | 12.8 |
| Queensland | 18.9 | 17.0 | 1.3 | 1.2 | 6.9 |
| South Australia | 24.3 | 21.7 | 3.6 | 0.5 | 14.8 |
| Western Australia | 17.6 | 17.0 | 0.3 | 0.7 | 1.7 |
| Tasmania | 16.8 | 13.2 | 2.5 | 2.0 | 14.9 |
| Northern Territory | 30.6 | 22.1 | 2.3 | 6.5 | 7.5 |
| Australian Capital Territory | 13.6 | 9.3 | 4.0 | 0.5 | 29.4 |
| Any capital city location only | 16.8 | 14.6 | 2.0 | 0.8 | 11.9 |
| State or territory capital city CBD only | 17.9 | 14.4 | 2.9 | 1.4 | 16.2 |
| Capital city metropolitan area outside of CBD only | 16.2 | 14.6 | 1.6 | 0.5 | 9.9 |
| Regional only | 20.5 | 17.7 | 1.7 | 1.4 | 8.3 |
| Other location combinations | 22.5 | 20.2 | 1.2 | 1.3 | 5.3 |
| Australia | 18.3 | 15.9 | 1.9 | 1.0 | 10.4 |
Source · ABS, Characteristics of Australian Business, 2024-25, Business finance and assistance, Table 2
Section 05 · Barriers
Which factors limited Australian businesses' access to finance in 2024-25?
Uncertainty about economic conditions was the most commonly reported factor limiting or preventing access to finance in 2024-251, reported by 11.0% of employing businesses.
Insufficient sales or cash flow was next at 9.4%, followed by insufficient collateral or security at 3.7%1.
High levels of business debt were reported by 3.5% of employing businesses1. Financial regulations and compliance were reported by 2.4%, and 1.8% reported that the business or project was considered high risk.
Overall, 18.9% of employing businesses reported at least one factor limiting or preventing access to finance1. A further 15.1% reported no limiting factors, while the remaining 66.0% were recorded as not applicable.
By employment size, businesses with 20 to 199 persons recorded the highest share reporting at least one limiting factor, at 20.9%1. Businesses with 200 or more persons recorded the lowest share at 14.1%.
By industry, accommodation and food services recorded the highest share reporting at least one limiting factor, at 29.6%1. Professional, scientific and technical services recorded the lowest share at 12.5%.
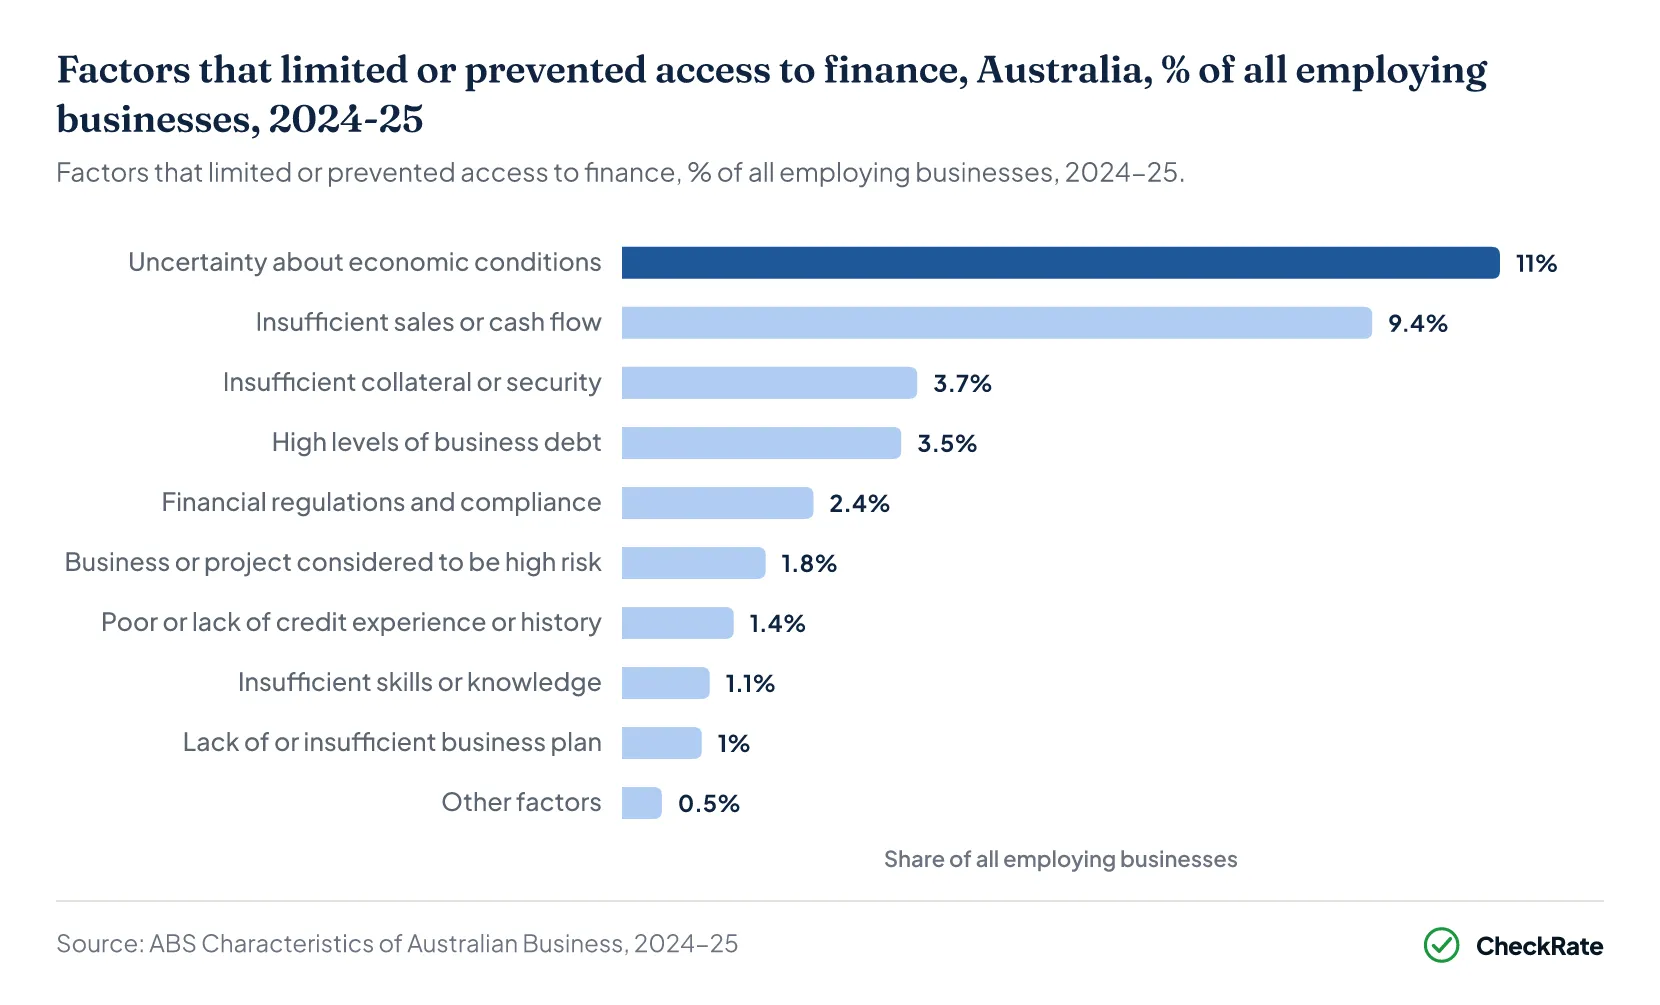
| Factors that limited or prevented access to finance, by employment size, Australia, % of all employing businesses, 2024-25 | |||||||
|---|---|---|---|---|---|---|---|
| Employment size | Uncertainty about economic conditions | Insufficient sales or cash flow | Insufficient collateral or security | High levels of business debt | Any limiting factor | No limiting factors | Not applicable |
| 0 to 4 persons | 10.8 | 9.6 | 3.6 | 2.7 | 18.6 | 13.4 | 68.0 |
| 5 to 19 persons | 10.7 | 8.9 | 3.9 | 5.0 | 19.1 | 17.4 | 63.5 |
| 20 to 199 persons | 13.1 | 10.3 | 4.0 | 4.0 | 20.9 | 19.8 | 59.3 |
| 200 or more persons | 9.5 | 6.3 | 3.5 | 5.5 | 14.1 | 23.7 | 62.2 |
| All businesses | 11.0 | 9.4 | 3.7 | 3.5 | 18.9 | 15.1 | 66.0 |
Source · ABS, Characteristics of Australian Business, 2024-25, Business finance and assistance, Table 5
Section 06 · Sources of finance
Which sources of finance did Australian businesses use in 2024-25?
Banks were the most common source of finance for businesses that sought finance in 2024-25, at 54.3% of finance-seeking businesses1. Finance companies were next at 41.6% of businesses, followed by the existing owners of the business at 20.4%.
Friends or family of the existing owners were used by 16.4% of finance-seeking businesses1. Other businesses were used by 4.1%, and 3.8% used venture capital or private equity funds.
Businesses could report more than one source of finance1.
Among businesses that sought finance, businesses with 200 or more persons recorded the highest share using banks among the four employment size groups, at 64.4%1. Businesses with 5 to 19 persons recorded the lowest share, at 52.3%.
The share using finance companies fell as business size increased, from 44.9% for businesses with 0 to 4 persons to 27.6% for those with 200 or more persons1.
By industry, agriculture, forestry and fishing recorded the highest share using banks at 91.8%1. Information media and telecommunications recorded the lowest share at 28.3%.
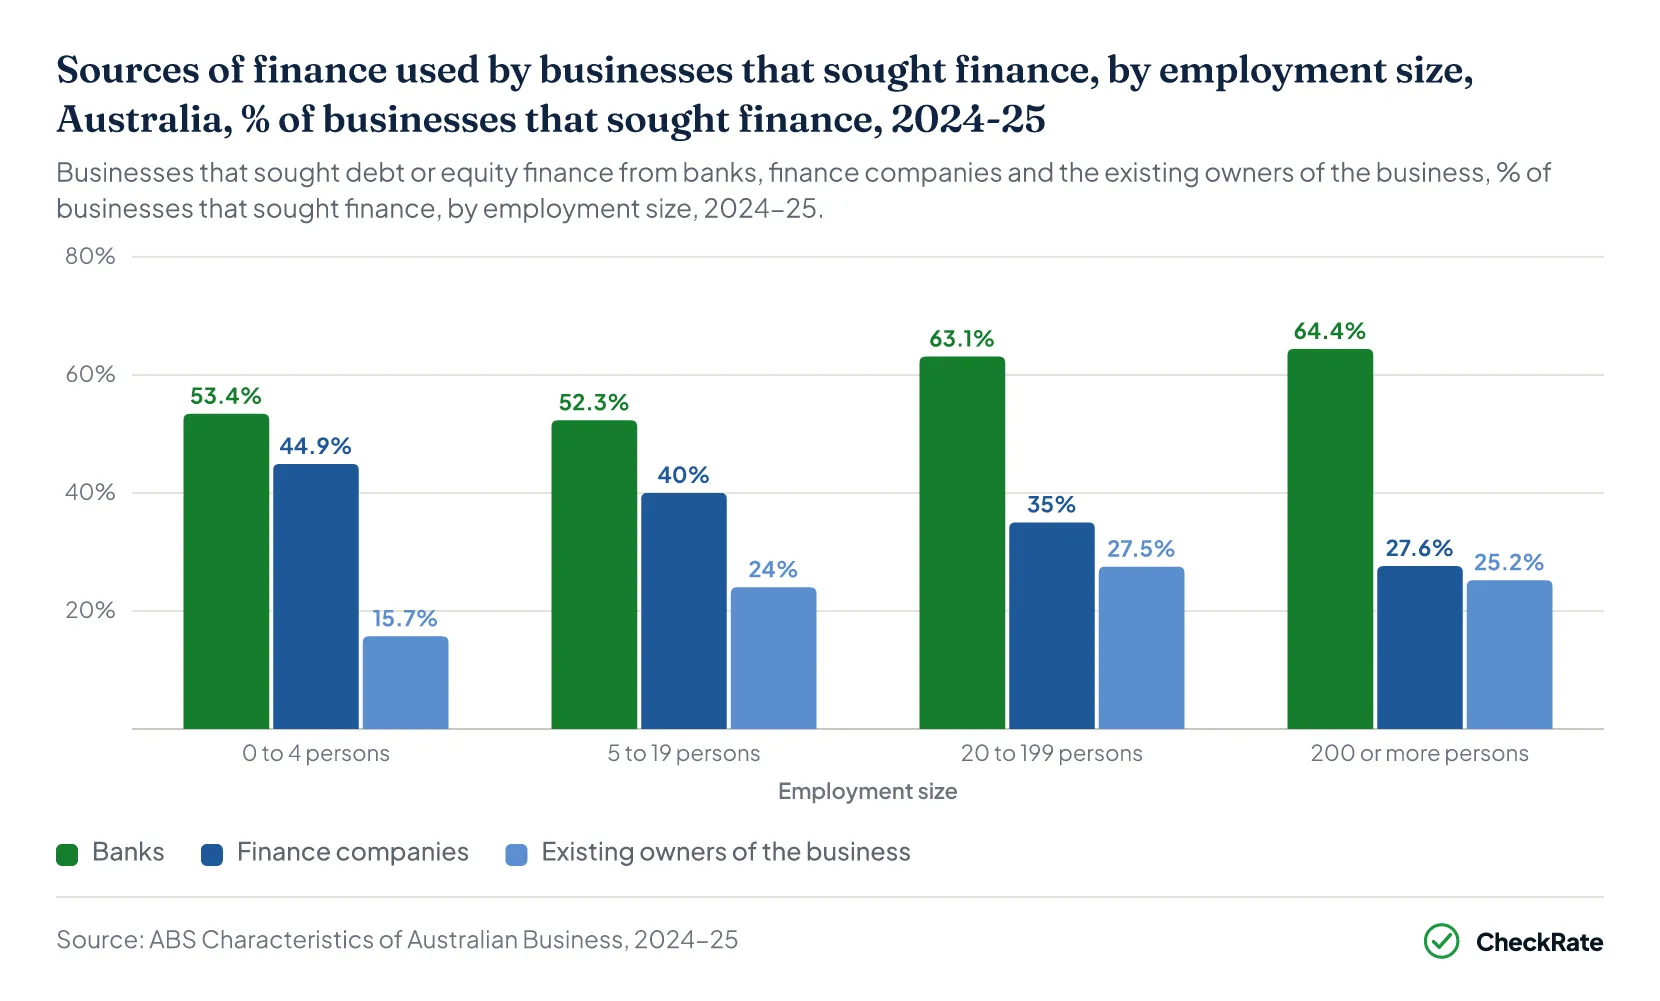
| Sources of finance used by businesses that sought finance, by employment size, Australia, % of businesses that sought finance, 2024-25 | ||||||
|---|---|---|---|---|---|---|
| Employment size | Banks | Finance companies | Existing owners of the business | Friends or family of existing owners | Other businesses | Venture capital or private equity funds |
| 0 to 4 persons | 53.4 | 44.9 | 15.7 | 16.3 | 3.9 | 3.6 |
| 5 to 19 persons | 52.3 | 40.0 | 24.0 | 19.3 | 4.0 | 2.9 |
| 20 to 199 persons | 63.1 | 35.0 | 27.5 | 8.1 | 5.2 | 7.6 |
| 200 or more persons | 64.4 | 27.6 | 25.2 | np | 1.5 | 6.1 |
| All businesses that sought finance | 54.3 | 41.6 | 20.4 | 16.4 | 4.1 | 3.8 |
Source · ABS, Characteristics of Australian Business, 2024-25, Business finance and assistance, Table 3
Section 07 · Security
How much small business lending in Australia is secured by residential property?
The Reserve Bank of Australia (RBA) reported $208.0 billion of small business loans outstanding at 30 June 2026, with $100.4 billion, or 48.3%, secured by residential property3.
The RBA's business-size classifications are based on lending definitions and differ from the ABS employment size groups3. Since June 2024, all reporting lenders have classified business size under APRA's prudential standards APS 112 and APS 113.
The average rate on outstanding small business loans was 7.46% in July 20264. For loans secured by residential property, the average rate was lower, at 6.98%.
The RBA reported in October 2025 that less than 5% of credit to small and medium enterprises (SMEs) was unsecured5. Around half of small-sized SME loans were secured by other assets, including vehicles and equipment, while a little under half were secured by residential property. New loans secured by residential property were on average 4.5 times as large as loans secured by other assets.
Lender liaison indicated that lending standards remained prudent in the year before October 20255. Some lenders had eased standards incrementally, including more willingness to lend with little or no security and a higher share of new SME loans approved through automated processes.
In a few cases, lenders lowered the benchmarks used in their serviceability assessments5. The RBA assessed that access to finance for small businesses had improved over the period, although small businesses continued to report challenges in obtaining finance on terms that suited their needs.
| Small business loans outstanding by security and average interest rates, Australia, 30 June 2026 and July 2026 | |||
|---|---|---|---|
| Measure | All small business loans | Secured by residential property | Other security or unsecured |
| Loans outstanding at 30 June 2026 ($ million) | 207,951 | 100,395 | 107,556 |
| Share of small business loans outstanding (%) | 100.0 | 48.3 | 51.7 |
| Average interest rate on outstanding loans, July 2026 (% per annum) | 7.46 | 6.98 | .. |
| Average interest rate on new loans funded in July 2026 (% per annum) | 7.44 | 6.89 | .. |
Source · RBA, Statistical Tables D14 and F7
Business lending rates by business size, rate type and security are set out in the business loan interest rates article.
Section 08 · 2021-22 compared
How did the share of businesses not obtaining finance change from 2021-22 to 2024-25?
The share of finance seekers that did not obtain finance fell from 14.1% in 2021-22 to 10.4% in 2024-256. That was a fall of 3.7 percentage points.
The share of businesses that sought finance rose from 14.9% of all employing businesses in 2021-22 to 18.3% in 2024-256. That was an increase of 3.4 percentage points.
The share of businesses that obtained finance rose from 11.9% of all employing businesses in 2021-22 to 15.9% in 2024-256. The share that did not obtain finance fell from 2.1% to 1.9%, while the share with finance in progress fell from 1.3% to 1.0%.
The ABS's 2024-25 release states that 5% of businesses sought finance in 2021-221. However, the 2021-22 release reports 15% in its commentary and 14.9% in its detailed figures. This article uses the detailed figures6.
Businesses with 0 to 4 persons recorded the highest share of finance seekers that did not obtain finance in both years. The share fell from 17.1% in 2021-22 to 13.0% in 2024-256. Businesses with 20 to 199 persons recorded the largest fall among the four employment size groups, from 8.6% to 3.4%, a decrease of 5.2 percentage points.
Uncertainty about economic conditions was reported as a factor limiting access to finance by 13.0% of employing businesses in 2021-22 and 11.0% in 2024-256. Insufficient collateral or security fell from 4.2% to 3.7%, while insufficient sales or cash flow remained at 9.4% in both years.
| Businesses that sought debt or equity finance and did not obtain it, by employment size, Australia, %, 2021-22 and 2024-25 | ||||||
|---|---|---|---|---|---|---|
| Employment size | Sought finance, 2021-22 (% of all employing businesses) | Sought finance, 2024-25 (% of all employing businesses) | Not obtained, 2021-22 (% of all employing businesses) | Not obtained, 2024-25 (% of all employing businesses) | Not obtained, 2021-22 (% of businesses that sought finance) | Not obtained, 2024-25 (% of businesses that sought finance) |
| 0 to 4 persons | 12.3 | 13.8 | 2.1 | 1.8 | 17.1 | 13.0 |
| 5 to 19 persons | 18.8 | 25.0 | 2.1 | 2.4 | 11.2 | 9.6 |
| 20 to 199 persons | 24.5 | 29.3 | 2.1 | 1.0 | 8.6 | 3.4 |
| 200 or more persons | 28.7 | 35.8 | 1.0 | 1.1 | 3.5 | 3.1 |
| All businesses | 14.9 | 18.3 | 2.1 | 1.9 | 14.1 | 10.4 |
Source · ABS, Characteristics of Australian Business, 2021-22 (Table 4) and 2024-25 (Table 2)
Section 09
Business loan rejection rates: quick answers
What percentage of business loan applications are rejected in Australia?
No official statistic counts business loan applications or rejections. The Australian Bureau of Statistics reports that 1.9% of employing businesses sought debt or equity finance in 2024-25 and did not obtain it, equivalent to 10.4% of the 18.3% that sought finance.
Do businesses with 0 to 4 persons fail to obtain finance more often than larger businesses?
Businesses with 0 to 4 persons had the highest share of finance seekers that did not obtain finance among the four employment size groups in 2024-25, at 13.0%, compared with 3.1% for businesses with 200 or more persons. The share was 9.6% for businesses with 5 to 19 persons and 3.4% for businesses with 20 to 199 persons.
References
- ABS, Characteristics of Australian Business, 2024-25 · Australian Bureau of Statistics ↑ b c d e f g h i j k l m n o p q r s t u v w x y z a2 b2 c2 d2 e2 f2 g2 h2 i2 j2
- ABS, Characteristics of Australian Business methodology, 2024-25 · Australian Bureau of Statistics ↑ b c
- RBA, Lending to Business: Business Finance Outstanding by Business Size and Interest Rate Type, Statistical Table D14 · Reserve Bank of Australia ↑ b
- RBA, Business Lending Rates: Statistical Table F7 · Reserve Bank of Australia ↑ b
- RBA Bulletin, Small Business Economic and Financial Conditions · Reserve Bank of Australia ↑ b c
- ABS, Characteristics of Australian Business, 2021-22 · Australian Bureau of Statistics ↑ b c d e f g