


Published
Section 01 · July 2026 headline
What share of Australian business lending do the four major banks have?
The four major banks accounted for 70.3% of the loans to non-financial businesses on the Australian books of authorised deposit-taking institutions (ADIs) at 31 July 20261. The Australian Prudential Regulation Authority (APRA) reported $1,269.4 billion of loans to non-financial businesses across all 119 reporting ADIs. The four major banks held $892.5 billion of these loans, while the other 115 ADIs held $376.9 billion.
The four largest business lenders at 31 July 2026 were the four banks APRA classifies as major banks2.
APRA publishes these balances on each ADI's Australian books, which exclude the ADI's overseas branches and any subsidiaries1. Loans to non-financial businesses exclude loans to financial institutions, to governments and to households.
| Loans to and deposits by non-financial businesses, the four major banks and all other ADIs, Australia, $ million and %, 31 July 2026 | ||||
|---|---|---|---|---|
| Lender group | Loans to non-financial businesses ($ million) | Share of ADI business loans (%) | Deposits by non-financial businesses ($ million) | Share of ADI business deposits (%) |
| The four major banks | 892,453 | 70.3 | 691,422 | 76.0 |
| All other ADIs (115) | 376,928 | 29.7 | 218,256 | 24.0 |
| All ADIs (119) | 1,269,380 | 100.0 | 909,677 | 100.0 |
Source · APRA, Monthly authorised deposit-taking institution statistics, July 2026, Tables 2 and 4.
Section 02 · Concentration
What share of Australian business lending do the 20 largest ADIs have?
The 20 largest ADIs accounted for 91.7% of loans to non-financial businesses at 31 July 20261. The largest eight ADIs accounted for 77.5%.
The fifth to eighth largest business lenders together had 7.2% of these loans, at $91.5 billion1. The ninth to 16th largest had 10.4%, at $131.9 billion. The 17th to 32nd largest had 8.8%, at $111.9 billion. The 87 ADIs ranked 33rd and below together had 3.3%, at $41.7 billion.
At 31 July 2026, 20 ADIs each had more than $10 billion of loans to non-financial businesses1.
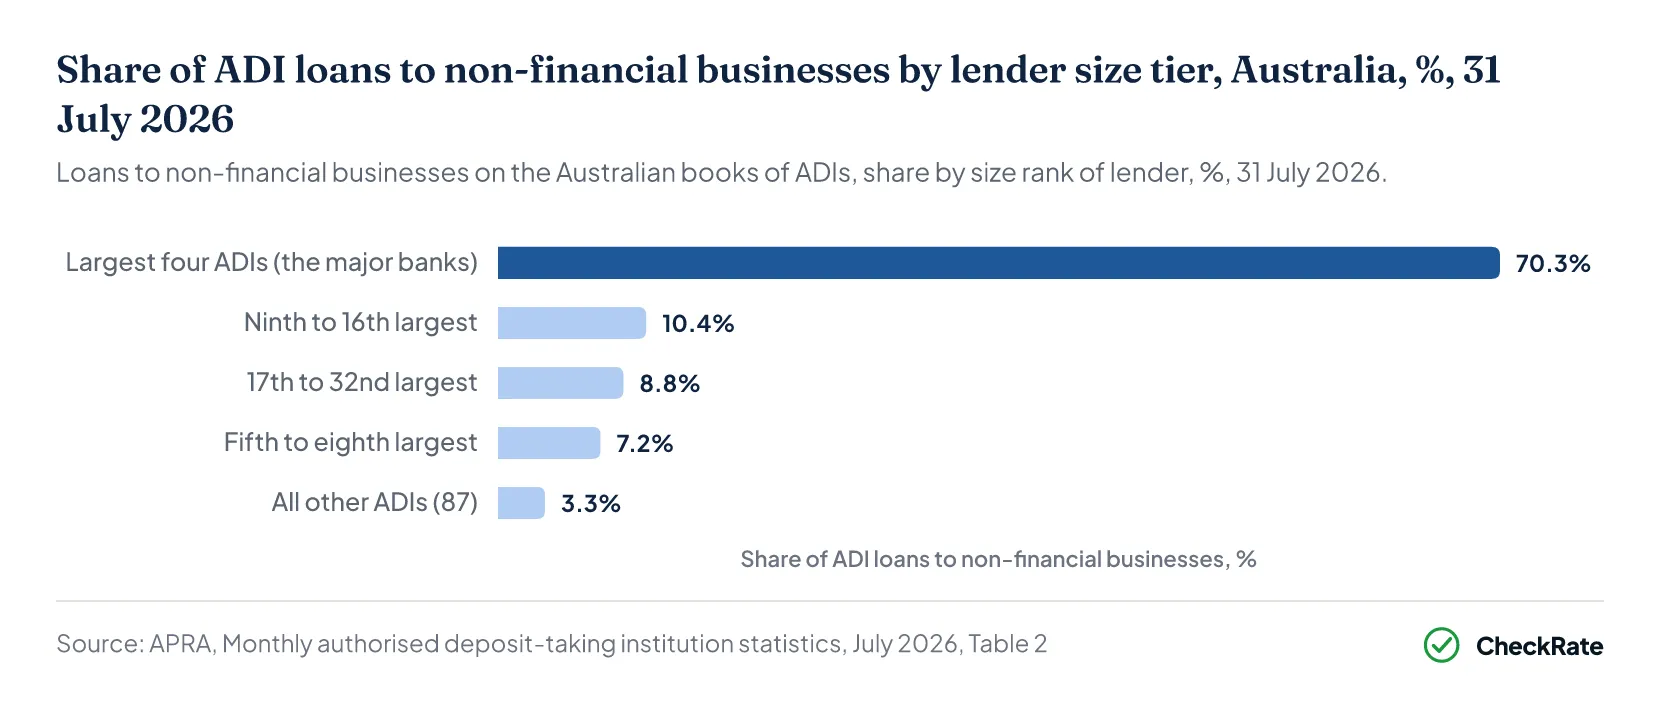
| Loans to non-financial businesses by lender size tier, Australia, $ million and %, 31 July 2026 | ||||
|---|---|---|---|---|
| Lender tier | ADIs | Loans to non-financial businesses ($ million) | Share of ADI business loans (%) | Cumulative share (%) |
| Largest four ADIs (the major banks) | 4 | 892,453 | 70.3 | 70.3 |
| Fifth to eighth largest | 4 | 91,480 | 7.2 | 77.5 |
| Ninth to 16th largest | 8 | 131,865 | 10.4 | 87.9 |
| 17th to 32nd largest | 16 | 111,895 | 8.8 | 96.7 |
| All other ADIs (87) | 87 | 41,688 | 3.3 | 100.0 |
| All ADIs | 119 | 1,269,380 | 100.0 | 100.0 |
Source · APRA, Monthly authorised deposit-taking institution statistics, July 2026, Table 2.
Section 03 · Business deposits
What share of Australian business deposits do the major banks have?
The four major banks accounted for 76.0% of deposits by non-financial businesses on the ADIs' books at 31 July 20261. APRA reported $909.7 billion of deposits by non-financial businesses across all ADIs. The other 115 ADIs had $218.3 billion of business deposits, or 24.0%.
Deposits by non-financial businesses grew 7.4% in the year to July 2026, from $847.1 billion at 31 July 2025 to $909.7 billion3. The four major banks' business deposits grew 7.7% over the year, compared with 6.5% at all other ADIs.
The major banks' share of business deposits rose from 75.8% at 31 July 2025 to 76.0% at 31 July 20263. Over the longer period, the share fell 0.2 percentage points from 76.2% at 31 July 2019 to 76.0% at 31 July 2026. Across the eight July month-ends from 2019 to 2026, the major banks' share of business deposits was highest in July 2022, at 78.4%, and lowest in July 2025, at 75.8%.
Deposits by non-financial businesses accounted for 26.0% of the $3,502.8 billion of resident deposits at ADIs at 31 July 20261. Household deposits accounted for 50.4%.
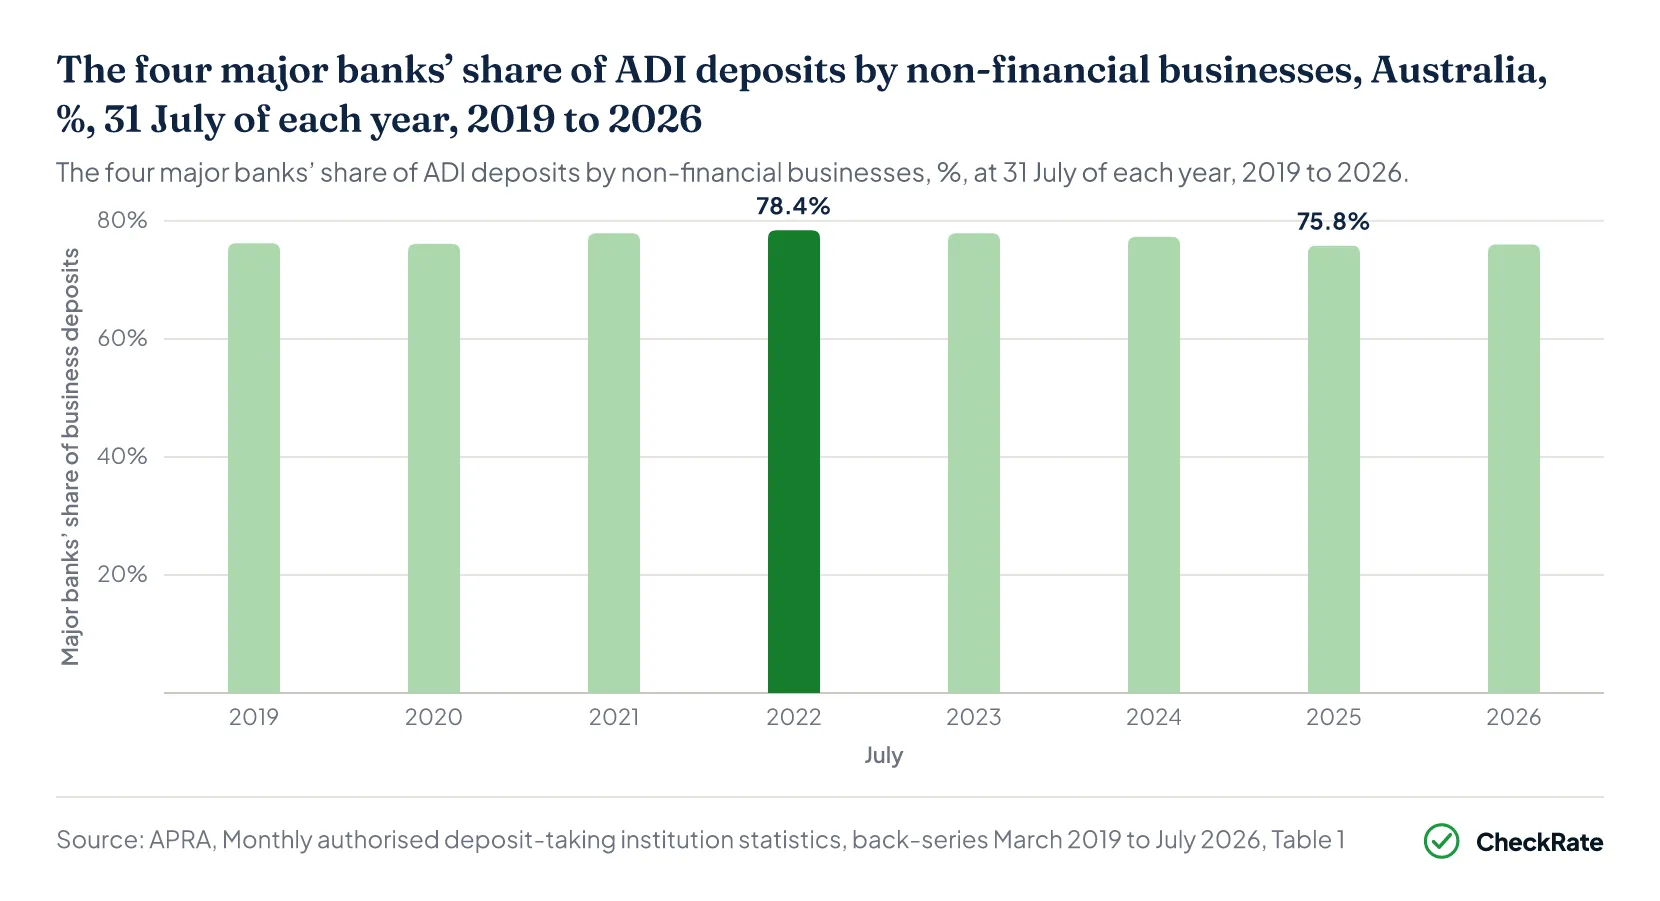
| Deposits by non-financial businesses, the four major banks and all other ADIs, Australia, $ million and %, 31 July of each year, 2019 to 2026 | ||||
|---|---|---|---|---|
| Month | Major banks ($ million) | All other ADIs ($ million) | All ADIs ($ million) | Major banks' share of business deposits (%) |
| July 2019 | 438,064 | 136,524 | 574,588 | 76.2 |
| July 2020 | 508,901 | 159,538 | 668,439 | 76.1 |
| July 2021 | 569,008 | 161,798 | 730,806 | 77.9 |
| July 2022 | 629,178 | 172,978 | 802,157 | 78.4 |
| July 2023 | 614,376 | 174,219 | 788,595 | 77.9 |
| July 2024 | 625,413 | 183,837 | 809,250 | 77.3 |
| July 2025 | 642,240 | 204,842 | 847,082 | 75.8 |
| July 2026 | 691,422 | 218,256 | 909,677 | 76.0 |
Source · APRA, Monthly authorised deposit-taking institution statistics, back-series March 2019 to July 2026, Table 1.
Section 04 · Business compared with housing
Do the major banks have a larger share of housing or business lending?
The four major banks had a larger share of housing lending than business lending at 31 July 2026, accounting for 73.2% of housing loans on ADIs' Australian books compared with 70.3% of loans to non-financial businesses1. The gap was 2.9 percentage points.
The major banks' share of investment housing loans was 76.3% at 31 July 2026, compared with 71.7%1 for owner-occupier housing loans. Their share of all resident loans and finance leases was 71.6%.
Among the eight resident loan categories APRA publishes, loans to financial institutions had the lowest major-bank share at 31 July 2026, at 56.9%1. Loans to non-financial businesses recorded the second-lowest major-bank share, at 70.3%.
The major banks' share of all resident deposits was 72.9% at 31 July 2026, compared with 72.0% for deposits by households1.
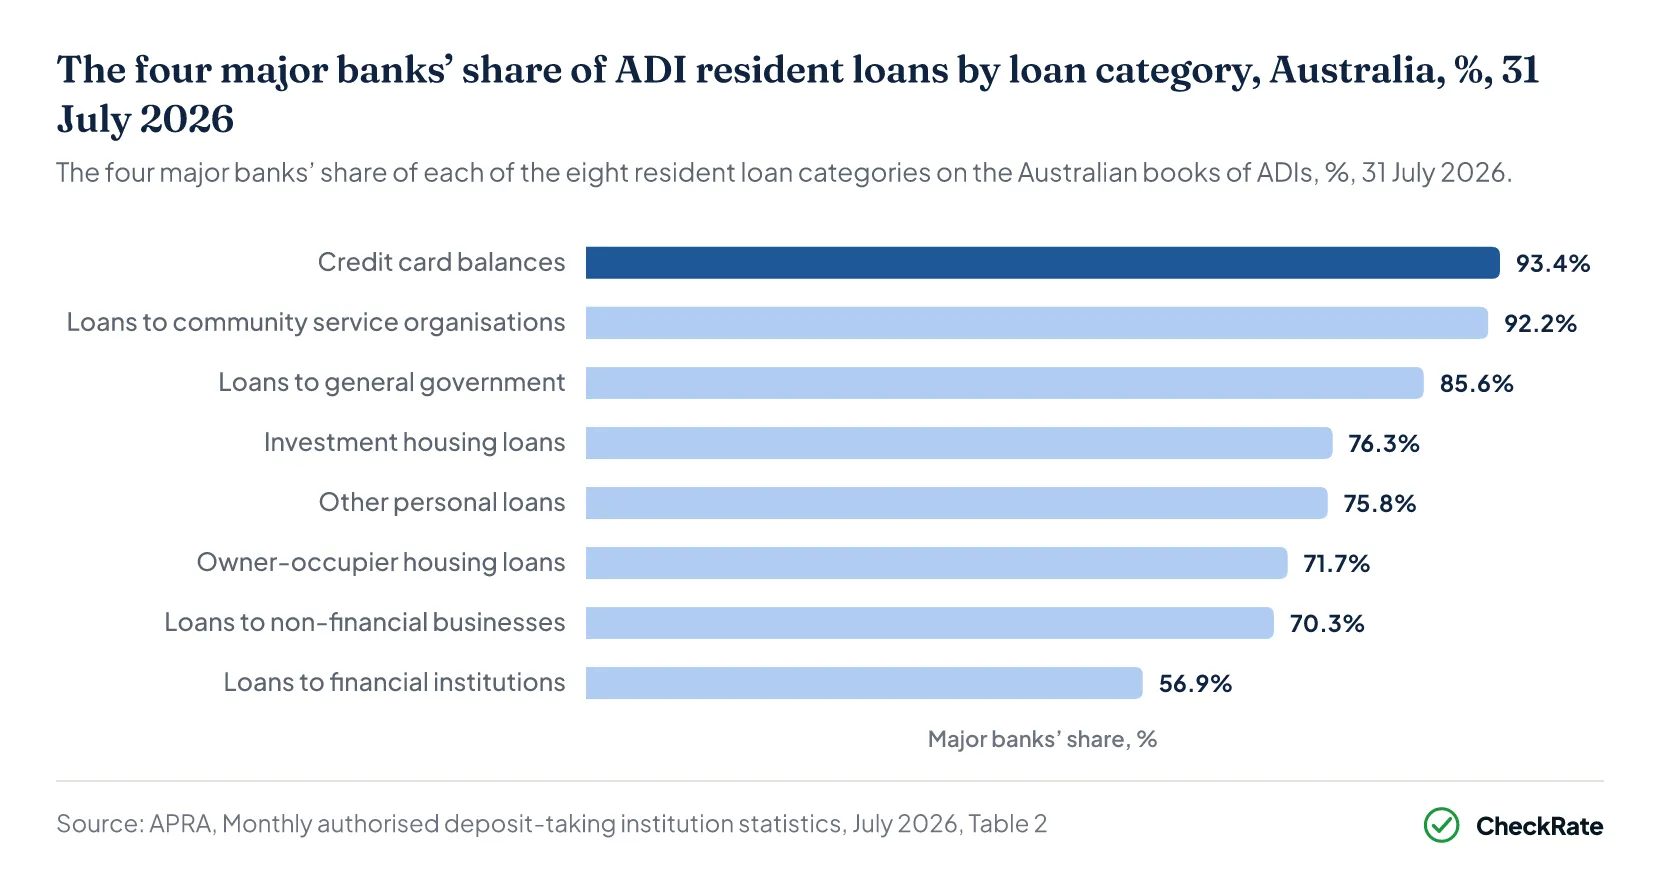
| The four major banks' share of ADI resident loans by loan category, and of aggregate and deposit balances, Australia, $ million and %, 31 July 2026 | |||
|---|---|---|---|
| Balance | All ADIs ($ million) | Four major banks ($ million) | Major banks' share (%) |
| Credit card balances | 27,002 | 25,227 | 93.4 |
| Loans to community service organisations | 4,208 | 3,879 | 92.2 |
| Loans to general government | 5,665 | 4,847 | 85.6 |
| Investment housing loans | 821,400 | 626,833 | 76.3 |
| Other personal loans | 69,954 | 53,046 | 75.8 |
| Owner-occupier housing loans | 1,690,048 | 1,211,995 | 71.7 |
| Loans to non-financial businesses | 1,269,380 | 892,453 | 70.3 |
| Loans to financial institutions | 237,147 | 134,968 | 56.9 |
| All housing loans (not ranked) | 2,511,449 | 1,838,828 | 73.2 |
| All resident loans and finance leases (not ranked) | 4,124,805 | 2,953,249 | 71.6 |
| Deposits by non-financial businesses (not ranked) | 909,677 | 691,422 | 76.0 |
| Deposits by households (not ranked) | 1,766,038 | 1,272,388 | 72.0 |
| All resident deposits (not ranked) | 3,502,783 | 2,552,487 | 72.9 |
Source · APRA, Monthly authorised deposit-taking institution statistics, July 2026, Tables 2 and 4.
Section 05 · Growth
How fast did major-bank business lending grow in the year to July 2026?
Loans to non-financial businesses at the four major banks grew 11.2% in the year to 31 July 2026, from $802.6 billion at 31 July 2025 to $892.5 billion3. Loans to non-financial businesses at all other ADIs grew 7.4%, from $351.1 billion to $376.9 billion.
Across all ADIs, loans to non-financial businesses grew 10.0% over the year, from $1,153.6 billion to $1,269.4 billion3. The four major banks accounted for 77.7% of the $115.8 billion increase in these loans.
APRA's monthly statistics covered 123 ADIs at 31 July 2025 and 119 at 31 July 20263.
Non-financial business credit across all lenders grew 10.6% in the year to July 2026, according to the Reserve Bank of Australia (RBA)4. This measure covers banks and non-bank lenders and adjusts for breaks in the underlying data, so it is not directly comparable with APRA's ADI loan balances.
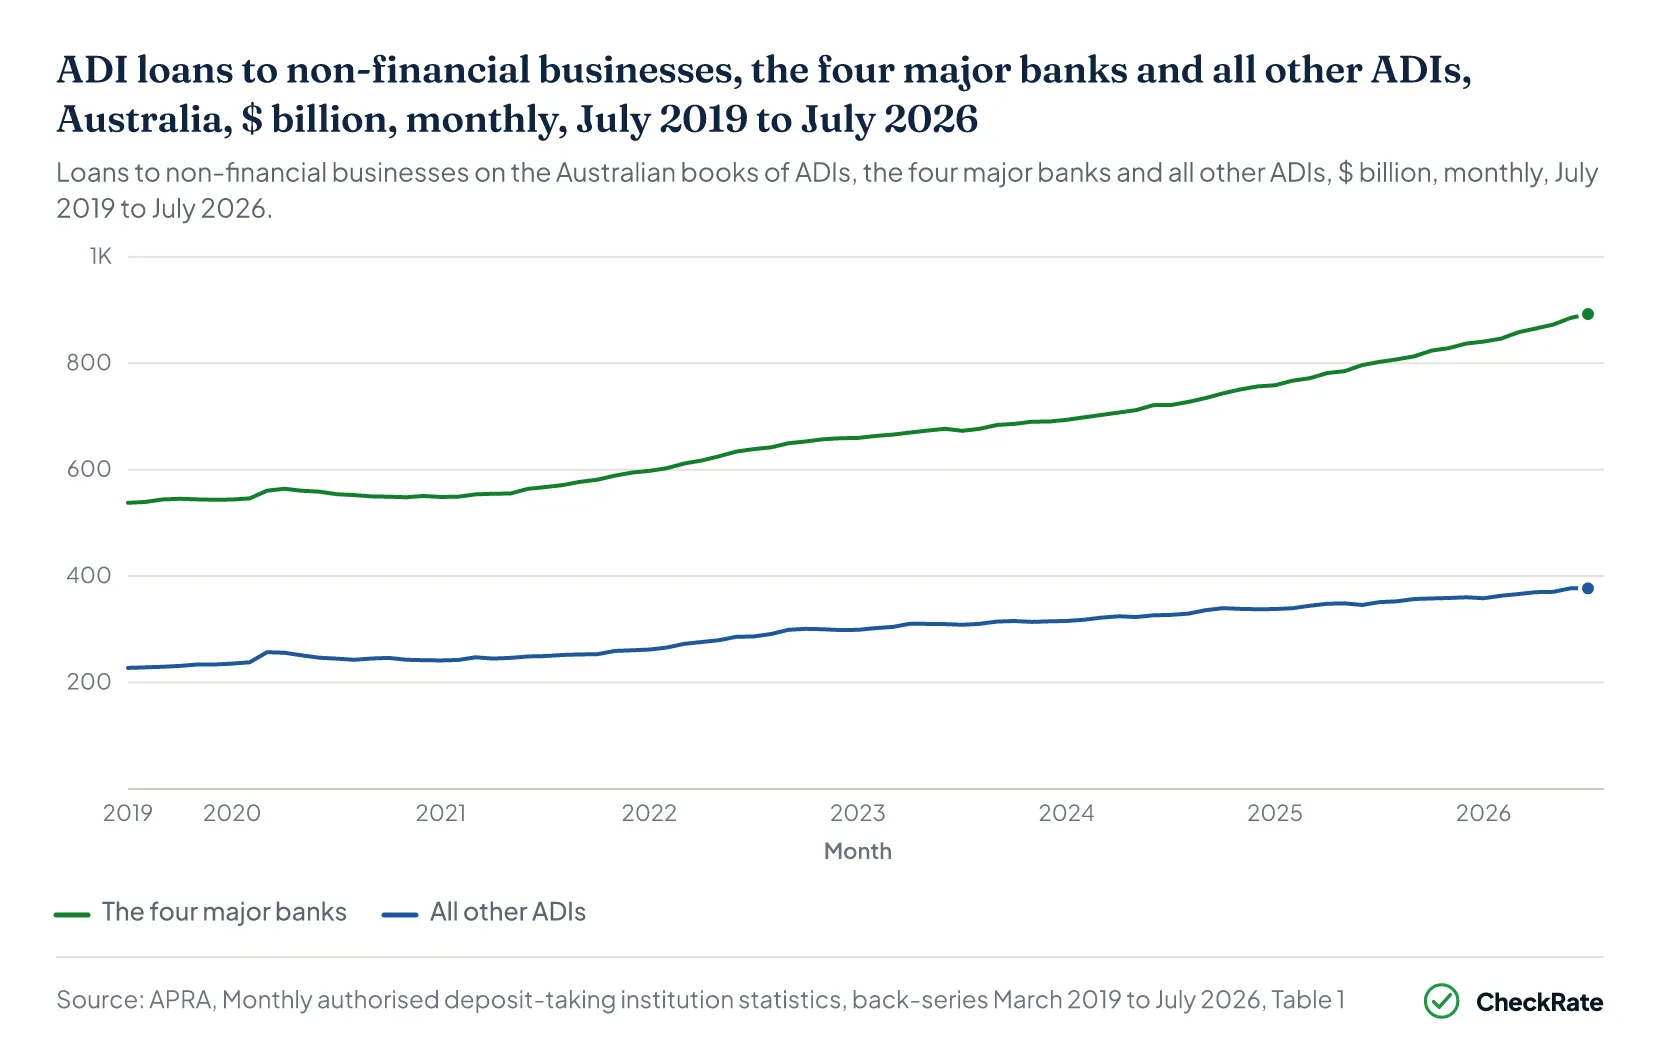
| Loans to non-financial businesses, the four major banks and all other ADIs, Australia, $ million and %, 31 July 2025 and 31 July 2026 | ||||
|---|---|---|---|---|
| Lender group | 31 July 2025 ($ million) | 31 July 2026 ($ million) | Change ($ million) | Change (%) |
| The four major banks | 802,559 | 892,453 | 89,894 | 11.2 |
| All ADIs other than the four major banks | 351,063 | 376,928 | 25,865 | 7.4 |
| All ADIs | 1,153,622 | 1,269,380 | 115,759 | 10.0 |
Source · APRA, Monthly authorised deposit-taking institution statistics, back-series March 2019 to July 2026, Table 1.
Section 06 · ADI groups
Which groups of ADIs make up Australia's banking sector?
APRA counted 120 ADIs at 31 March 2026 across the groups shown in its quarterly statistics, excluding the segment it calls other ADIs2. The count fell by six over the year from 126 at 31 March 2025. APRA's monthly statistics, which count each reporting licence, covered 119 ADIs at 31 July 20261.
APRA defines the major banks as four named banks and their subsidiary banks, and other domestic banks as all other locally owned banks2. Foreign branch banks are subject to restrictions on their deposit-taking. APRA also counted 51 mutual ADIs, which are included within the bank and credit union segments.
On the consolidated group basis APRA uses for its quarterly statistics, the major banks had $3,547.4 billion of gross loans and advances at 31 March 2026, or 76.2% of the $4,654.1 billion across the 120 ADIs included in these groups2. Other domestic banks had $547.2 billion, or 11.8% of the total, and foreign branch banks had $363.0 billion, or 7.8%.
Housing loans made up 62.9% of the major banks' gross loans and advances at 31 March 2026, compared with 0.1% for foreign branch banks and 81.0% for other domestic banks2.
The major banks' share of commercial property exposures across ADIs is set out in the commercial property lending statistics article.
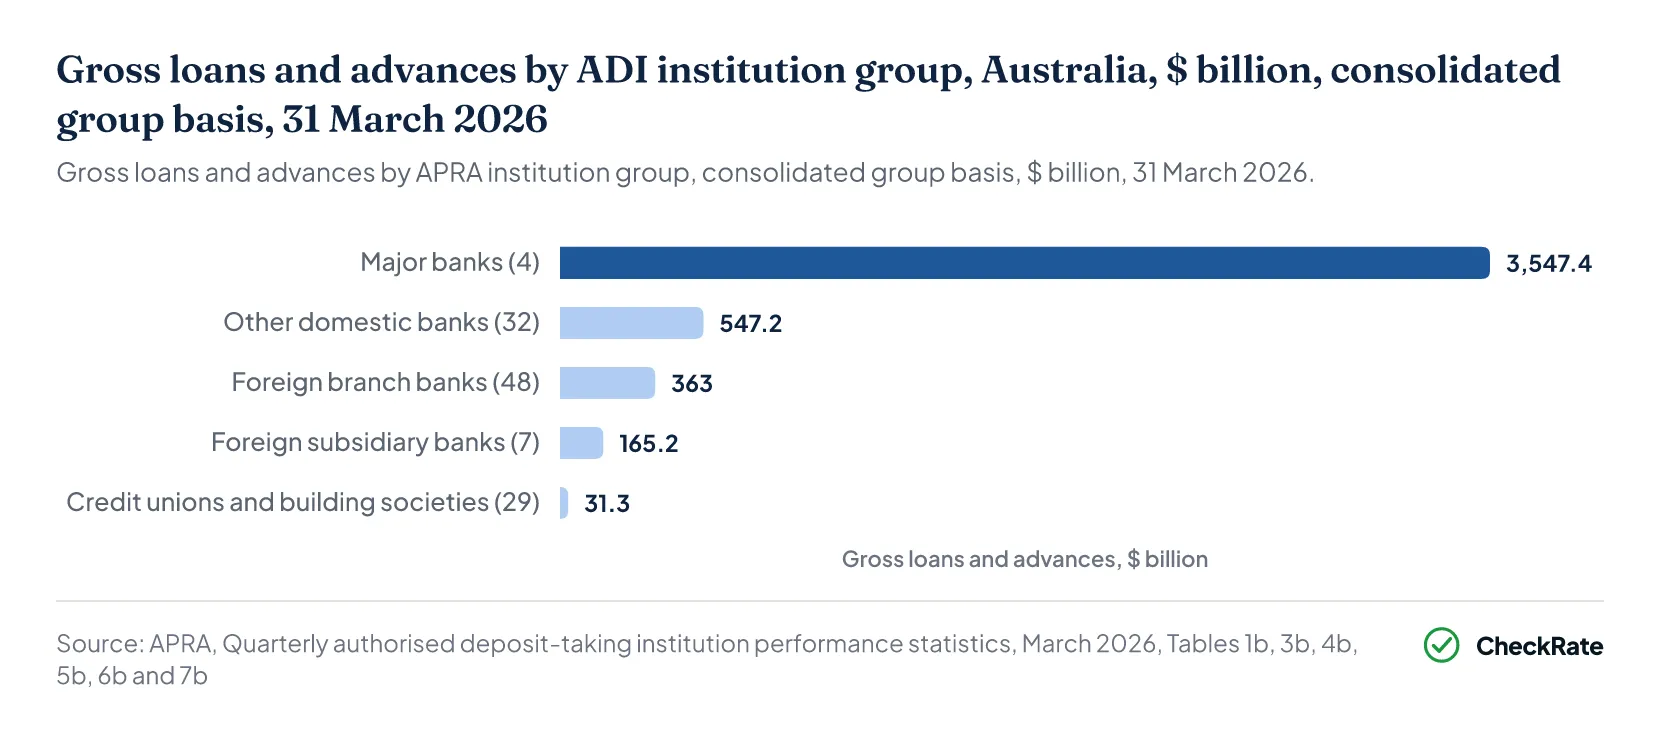
| ADIs by institution group: entities, gross loans and advances, housing loans and deposits, Australia, $ million and %, consolidated group basis, 31 March 2026 | |||||
|---|---|---|---|---|---|
| Institution group | Entities | Gross loans and advances ($ million) | Of which housing ($ million) | Deposits ($ million) | Share of gross loans (%) |
| Major banks | 4 | 3,547,406 | 2,232,798 | 3,474,827 | 76.2 |
| Other domestic banks | 32 | 547,191 | 442,957 | 584,849 | 11.8 |
| Foreign branch banks | 48 | 362,976 | 264 | 298,724 | 7.8 |
| Foreign subsidiary banks | 7 | 165,239 | 119,559 | 151,004 | 3.6 |
| Credit unions and building societies | 29 | 31,326 | 29,480 | 32,658 | 0.7 |
| All ADIs excluding other ADIs | 120 | 4,654,138 | 2,825,057 | 4,542,062 | 100.0 |
Source · APRA, Quarterly authorised deposit-taking institution performance statistics, September 2004 to March 2026, Tables 1b, 3b, 4b, 5b, 6b and 7b.
Section 07 · Total business lending
How much do Australian ADIs lend to businesses?
ADIs had $1,269.4 billion of loans to non-financial businesses on their Australian books at 31 July 2026, equal to 30.8% of their $4,124.8 billion in resident loans and finance leases1. Housing loans to households made up 60.9%, at $2,511.4 billion, while loans to financial institutions made up 5.7%, at $237.1 billion.
ADIs lent about twice as much for housing as to non-financial businesses at 31 July 20261.
The RBA reported $1,440.6 billion of non-financial business credit at the end of July 20265. This was $171.2 billion higher than the ADI loans reported by APRA. The RBA measure includes non-bank lenders and securitised loans, which the ADI balances exclude.
The RBA's March 2026 Financial Stability Review reported that credit extended by non-banks was growing faster than bank credit and that non-bank lenders accounted for 6% of financial system assets6.
In October 2025, the RBA reported that the non-bank share of lending to small and medium enterprises had increased since the start of 2022, with a larger rise for smaller loans7.
It also reported that several banks, including the major banks, had used their profit reporting to signal plans to expand business lending7.
APRA's monthly statistics do not split loans to non-financial businesses by business size or industry1.
Lending to small and medium businesses by size, industry and security is set out in the SME lending statistics article.
| Resident loans and finance leases on the Australian books of ADIs by borrower sector, Australia, $ million and %, 31 July 2026 | ||
|---|---|---|
| Borrower sector | Loans and finance leases ($ million) | Share of ADI resident loans (%) |
| Housing: owner-occupied | 1,690,048 | 41.0 |
| Non-financial businesses | 1,269,380 | 30.8 |
| Housing: investment | 821,400 | 19.9 |
| Financial institutions | 237,147 | 5.7 |
| Other personal (households) | 69,954 | 1.7 |
| Credit cards (households) | 27,002 | 0.7 |
| General government | 5,665 | 0.1 |
| Community service organisations | 4,208 | 0.1 |
| All resident loans and finance leases | 4,124,805 | 100.0 |
Source · APRA, Monthly authorised deposit-taking institution statistics, July 2026, Table 2, TOTAL row.
Section 08 · Since 2019
How has the major banks' share of Australian business lending changed since 2019?
The four major banks' share of ADI loans to non-financial businesses was 70.27% at 31 July 2019 and 70.31% at 31 July 2026, which rounds to 70.3% in both years3. In between, the share fell to a low of 68.3% in April 2023. The share at 31 July 2026 was 2.0 percentage points above this low.
The share was less than 69% at 31 of the 85 month-ends from July 2019 to July 2026, the first in March 2020 and the last in November 20243. The share was 70% or more at 10 of the 85 month-ends.
Loans to non-financial businesses at the four major banks grew 66.0% over the period, from $537.7 billion at 31 July 2019 to $892.5 billion at 31 July 20263. Loans to non-financial businesses at all ADIs other than the four major banks grew 65.7%, from $227.4 billion to $376.9 billion.
Among the eight July month-ends from 2019 to 2026, the major banks' share was lowest in July 2023, at 68.6%3.
The number of ADIs reporting to APRA fell from 127 at 31 July 2019 to 119 at 31 July 20263.
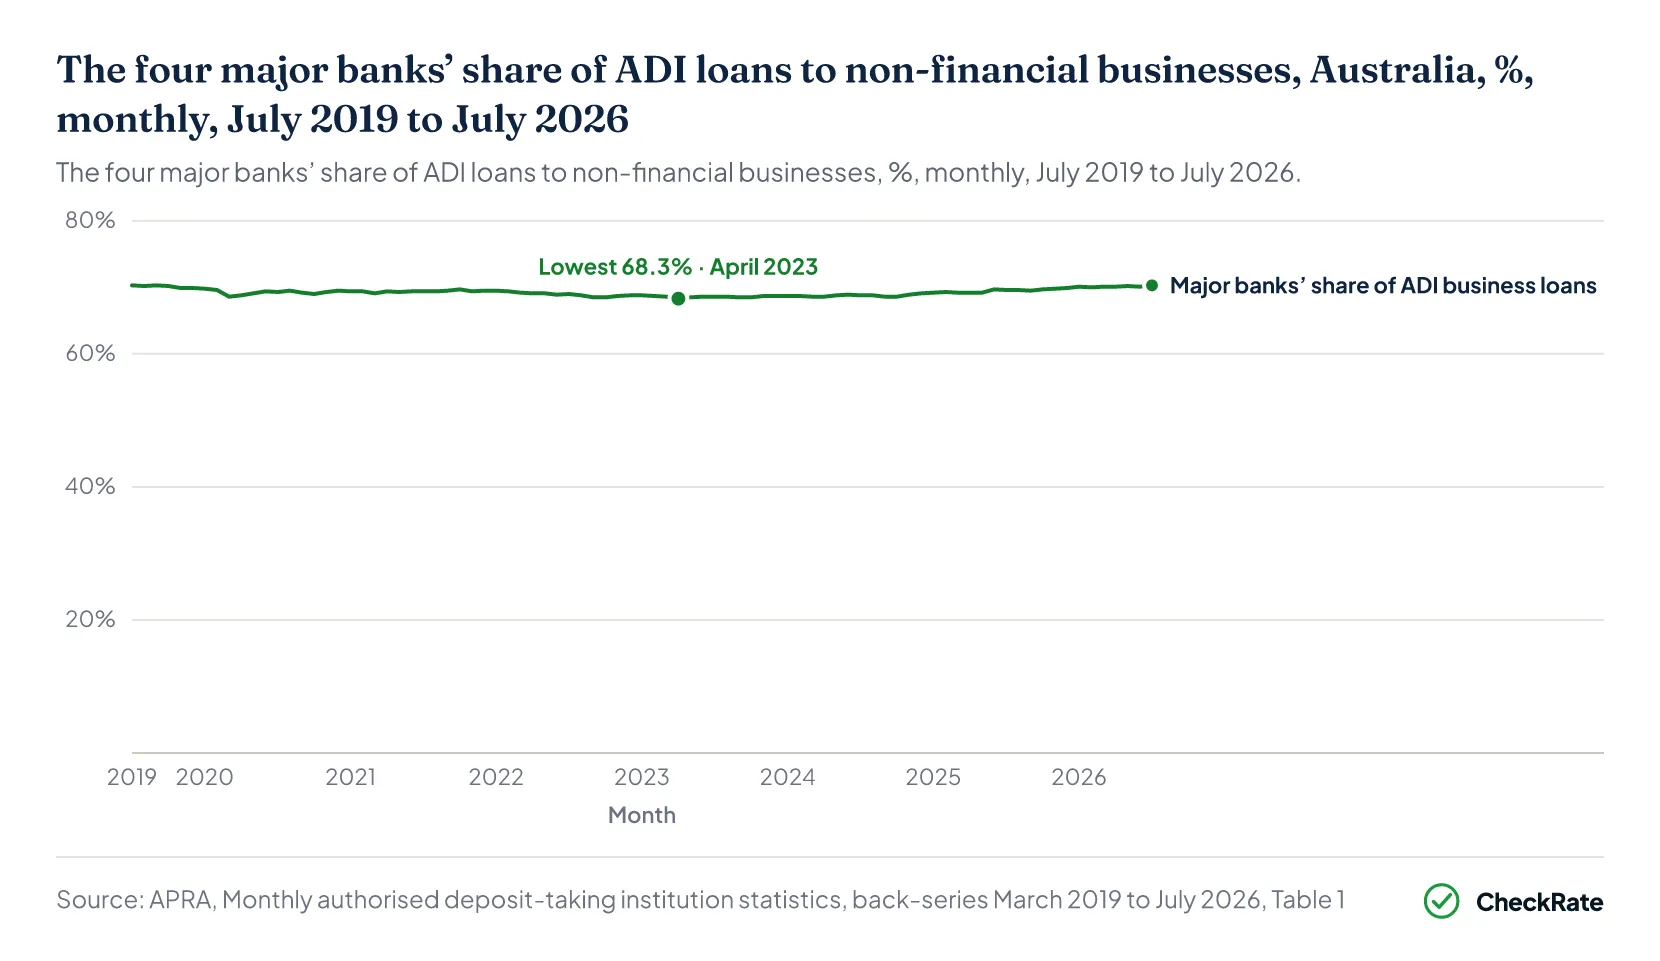
| Loans to non-financial businesses, the four major banks and all other ADIs, Australia, $ million and %, 31 July of each year, 2019 to 2026 | |||||
|---|---|---|---|---|---|
| Month | Major banks ($ million) | All other ADIs ($ million) | All ADIs ($ million) | Major banks' share (%) | Reporting ADIs |
| July 2019 | 537,654 | 227,447 | 765,101 | 70.3 | 127 |
| July 2020 | 553,922 | 244,913 | 798,834 | 69.3 | 124 |
| July 2021 | 567,319 | 249,651 | 816,969 | 69.4 | 124 |
| July 2022 | 638,587 | 286,631 | 925,218 | 69.0 | 126 |
| July 2023 | 673,118 | 308,492 | 981,610 | 68.6 | 126 |
| July 2024 | 721,499 | 327,108 | 1,048,607 | 68.8 | 126 |
| July 2025 | 802,559 | 351,063 | 1,153,622 | 69.6 | 123 |
| July 2026 | 892,453 | 376,928 | 1,269,380 | 70.3 | 119 |
Source · APRA, Monthly authorised deposit-taking institution statistics, back-series March 2019 to July 2026, Table 1.
Section 09
Business banking market share: quick answers
How much business lending do the four major banks have in dollars?
The four major banks had $892.5 billion of loans to non-financial businesses on their Australian books at 31 July 2026, out of $1,269.4 billion across all ADIs reported by the Australian Prudential Regulation Authority. That is 70.3%, and the other 115 ADIs had the remaining $376.9 billion.
References
- APRA, Monthly authorised deposit-taking institution statistics, July 2026 · apra.gov.au ↑ b c d e f g h i j k l m n o p q r s t
- APRA, Quarterly authorised deposit-taking institution performance statistics, September 2004 to March 2026 · apra.gov.au ↑ b c d e f
- APRA, Monthly authorised deposit-taking institution statistics, back-series March 2019 to July 2026 · apra.gov.au ↑ b c d e f g h i j k
- RBA, Growth in Selected Financial Aggregates, Statistical Table D1 · Reserve Bank of Australia ↑ b
- RBA, Lending and Credit Aggregates, Statistical Table D2 · Reserve Bank of Australia ↑
- RBA, Financial Stability Review, March 2026, chapter 3: Resilience of the Australian Financial System · Reserve Bank of Australia ↑
- RBA Bulletin, Small Business Economic and Financial Conditions · Reserve Bank of Australia ↑ b