Average salary by state: ranked highest to lowest
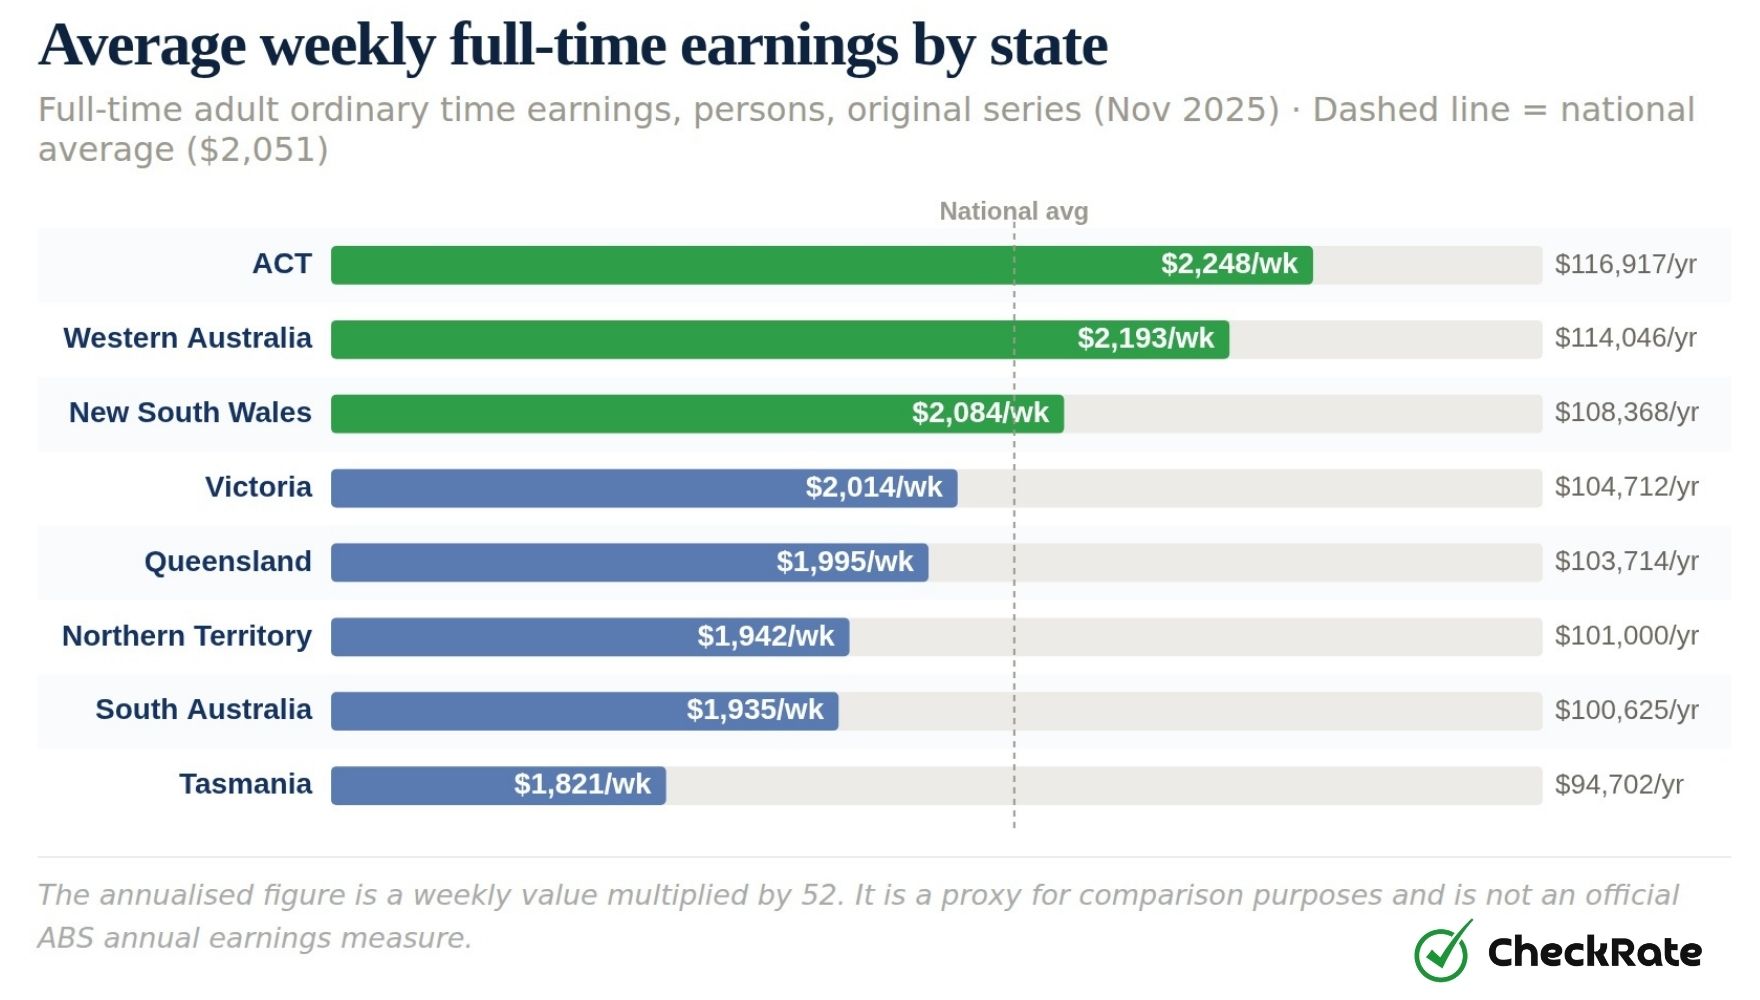
The national average for full-time adult ordinary time earnings was $2,051 a week in November 2025. That works out to about $106,657 a year on a 52-week basis.
The ACT recorded the highest average, at $2,248 a week, while Tasmania recorded the lowest, at $1,821 a week. That leaves a $427 weekly gap between the highest and lowest states and territories.
Only the ACT and Western Australia sat above the national average, at 9.6% and 6.9% higher, respectively. Most other states sat close to the national figure, while Tasmania was the main exception at 11.2% below.
New South Wales is often assumed to lead Australia on earnings, but it recorded $2,084 a week, just 1.6% above the national average.
| State or territory | Weekly | Annual proxy | vs national | Male wk | Female wk |
|---|---|---|---|---|---|
| Australian Capital Territory | $2,248 | $116,917 | +9.6% | $2,306 | $2,183 |
| Western Australia | $2,193 | $114,046 | +6.9% | $2,360 | $1,905 |
| New South Wales | $2,084 | $108,368 | +1.6% | $2,184 | $1,936 |
| Victoria | $2,014 | $104,712 | −1.8% | $2,108 | $1,869 |
| Queensland | $1,995 | $103,714 | −2.8% | $2,077 | $1,855 |
| Northern Territory | $1,942 | $101,000 | −5.3% | $2,037 | $1,828 |
| South Australia | $1,935 | $100,625 | −5.7% | $1,991 | $1,845 |
| Tasmania | $1,821 | $94,702 | −11.2% | $1,825 | $1,814 |
| Australia (national) | $2,051 | $106,657 | — | $2,148 | $1,901 |
Why WA wages sit above the national average
WA has recorded above-average full-time earnings for well over a decade. This is likely influenced by the state's workforce mix, rather than a recent change in the labour market.
The clearest factor is industry mix. Mining is Australia's highest-paying major industry, and WA has a much larger mining workforce than any other state. At the 2021 Census, iron ore mining accounted for 2.9% of employed WA residents, compared with 0.4% nationally. ABS jobs data from 2022–23 shows median employment income in mining was $149,362, compared with $60,301 across all industries.
WA also has a higher share of technical, trade and machinery workers. Technicians and trades workers made up 15.3% of WA's employed population at the 2021 Census, compared with 12.9% nationally. Machinery operators and drivers accounted for 7.7%, compared with 6.3% nationally.
Longer working hours also play a role. At the 2021 Census, 22.6% of employed WA residents worked 45 hours or more per week, compared with 17.9% nationally.
WA's wage growth has also stayed above the national pace. The Wage Price Index for March 2026 showed WA wages growing at 3.6% year-on-year, compared with 3.3% nationally. This suggests WA's earnings premium is not narrowing in the near term.
Why Canberra's workforce lifts ACT average earnings
The ACT is the clearest high-wage outlier in Australia. Its $197 weekly gap above the national average is nearly six times larger than the $33 weekly gap in New South Wales.
At the 2021 Census, 31.4% of employed ACT residents worked in professional roles, compared with 24.0% nationally. A further 17.9% worked as managers, compared with 13.7% nationally.
Central government administration accounted for 17.1% of ACT employment, compared with 1.1% across Australia. Defence added another 5.8%, compared with 0.7% nationally.
Public administration is one of Australia's better-paying industry groups, and it forms the core of the ACT economy because Canberra is the seat of federal government.
Education levels also support the ACT's higher earnings. At the 2021 Census, 42.9% of ACT residents aged 15 and over held a bachelor's degree or higher, compared with 26.3% nationally. This was the highest share in Australia.
The ACT's high earnings can also make the national average look higher than it is for workers in most states and territories. Its population is small, but its wages are unusually high, which lifts the national figure. That means the national average may not reflect what most Australian full-time workers actually earn.
The ACT also has a smaller gender pay gap by national standards. Male full-time adults earned $2,306 a week and female full-time adults $2,183, a $123 weekly gap equivalent to 5.3%. That is less than half the national gap of 11.5%.
Capital city vs regional wages in Australia
The regional earnings picture in Australia is not as simple as "capital cities pay more".
The latest official regional income data is from 2022–23. It shows that some of the highest-earning areas are in inner-city locations, including Barton in the ACT, where median employment income was $99,050, and Kingston in the ACT, where it was $92,000.
However, some high-earning areas are outside capital cities. These include resource-linked communities such as Roxby Downs in South Australia at $87,450 and Ashburton in Western Australia at $87,409. At the local government level, top-earning areas included Roxby Downs, Ashburton, Weipa, North Sydney and Port Hedland.
The ABS Average Weekly Earnings survey is measured at state and territory level. It does not break earnings down by capital city or regional area. For regional income comparisons, the latest official data comes from the ABS Linked Employer-Employee Dataset, known as LEED, with 2022–23 the latest published year.
In many service-based states, capital city workers still tend to earn more than regional workers. This is generally the case in places such as Sydney, Melbourne and Brisbane. But in Western Australia, South Australia and parts of Queensland, resource-linked regional labour markets can record higher median employment incomes than many capital city areas.
Average salary vs cost of living by state
Tasmania recorded the lowest average full-time earnings among states and territories, while Hobart recorded the highest capital-city CPI increase in the year to March 2026. Hobart's CPI rose 5.1%, while full-time adult ordinary-time earnings in Tasmania averaged $1,821 a week in November 2025.
The ACT sits at the other end of this comparison. It recorded the highest average full-time earnings, while Canberra had one of the lowest capital-city CPI increases at 4.2%, equal with Darwin.
| State or territory | Annual proxy | Capital city CPI (yr to Mar 2026) | Position |
|---|---|---|---|
| Australian Capital Territory | $116,917 | Canberra: 4.2% | Highest salary, lowest CPI |
| Western Australia | $114,046 | Perth: 4.6% | High salary |
| New South Wales | $108,368 | Sydney: 4.4% | Near national avg |
| Victoria | $104,712 | Melbourne: 4.6% | Near national avg |
| Queensland | $103,714 | Brisbane: 4.7% | Near national avg |
| Northern Territory | $101,000 | Darwin: 4.2% | Low CPI, lower salary |
| South Australia | $100,625 | Adelaide: 4.9% | Below avg salary, higher CPI |
| Tasmania | $94,702 | Hobart: 5.1% | Lowest salary, highest CPI |
The gap between the lowest and highest capital city CPI rates was relatively small, with Canberra and Darwin at 4.2% and Hobart at 5.1% in the year to March 2026. However, even small inflation differences can build over time.
For workers earning near the Tasmanian average, lower full-time earnings combined with higher Hobart CPI growth may indicate less favourable income-and-inflation conditions than salary figures alone show.
The ACT ranks highest on this proxy measure, with the highest average full-time earnings and one of the lowest capital-city CPI increases. Tasmania and Hobart show the opposite pattern: lower average full-time earnings alongside higher capital-city CPI growth.
Average earnings growth by state and territory since 2020
Between November 2020 and November 2025, the national average for full-time adult ordinary time earnings grew by 19.8%. Weekly earnings rose from $1,712 to $2,051.
Growth varied across the states and territories. South Australia recorded the fastest increase at 25.4%, followed by Queensland at 23.5% and Tasmania at 22.4%.
The Northern Territory recorded the weakest growth at 14.0%, which means it fell further behind the national average over this period.
South Australia and Queensland recorded strong growth from lower starting points. South Australia started at $1,543 a week in November 2020, while Queensland started at $1,615. Their percentage gains partly reflect catch-up growth from below the national average. Despite those increases, both states still sit below the national average in dollar terms.
Victoria's position changed notably over the period. In November 2020, Victoria sat just above the national average at $1,719 a week. By November 2025, it had fallen to 1.8% below the national average, with the weekly gap widening to around $37.
The Northern Territory fell the most in relative terms. Its weekly earnings were $8 below the national average in November 2020, but had dropped to $109 below by November 2025.
| State or territory | Nov 2020 | Nov 2025 | Change ($) | Change (%) | Gap vs nat. (2025) |
|---|---|---|---|---|---|
| South Australia | $1,543 | $1,935 | +$392 | +25.4% | −$116 |
| Queensland | $1,615 | $1,995 | +$379 | +23.5% | −$56 |
| Tasmania | $1,488 | $1,821 | +$333 | +22.4% | −$230 |
| Western Australia | $1,841 | $2,193 | +$353 | +19.2% | +$142 |
| ACT | $1,890 | $2,248 | +$358 | +19.0% | +$197 |
| New South Wales | $1,752 | $2,084 | +$332 | +19.0% | +$33 |
| Victoria | $1,719 | $2,014 | +$295 | +17.2% | −$37 |
| Northern Territory | $1,704 | $1,942 | +$239 | +14.0% | −$109 |
| Australia (national) | $1,712 | $2,051 | +$340 | +19.8% | — |
The top-to-bottom spread widened in dollar terms but narrowed as a percentage. The ACT-to-Tasmania gap rose from $402 a week in November 2020 to $427 in November 2025. In percentage terms, the spread fell from about 27% to 23.5%, suggesting some convergence from below even as the absolute gap grew.
Australia's 30-year earnings trend: nominal vs real wages by state
Over the 30 years to November 2025, full-time earnings increased across every state and territory in dollar terms. However, inflation changes how far those wages actually go.
Between November 2020 and November 2025, Australia's average full-time ordinary time earnings rose by 19.8%. Over the same period, CPI rose by about 22%. This means average full-time earnings were about 2% lower after inflation.
The fall was sharpest in 2022–23, when annual inflation rose above 7% and wage growth did not keep pace.
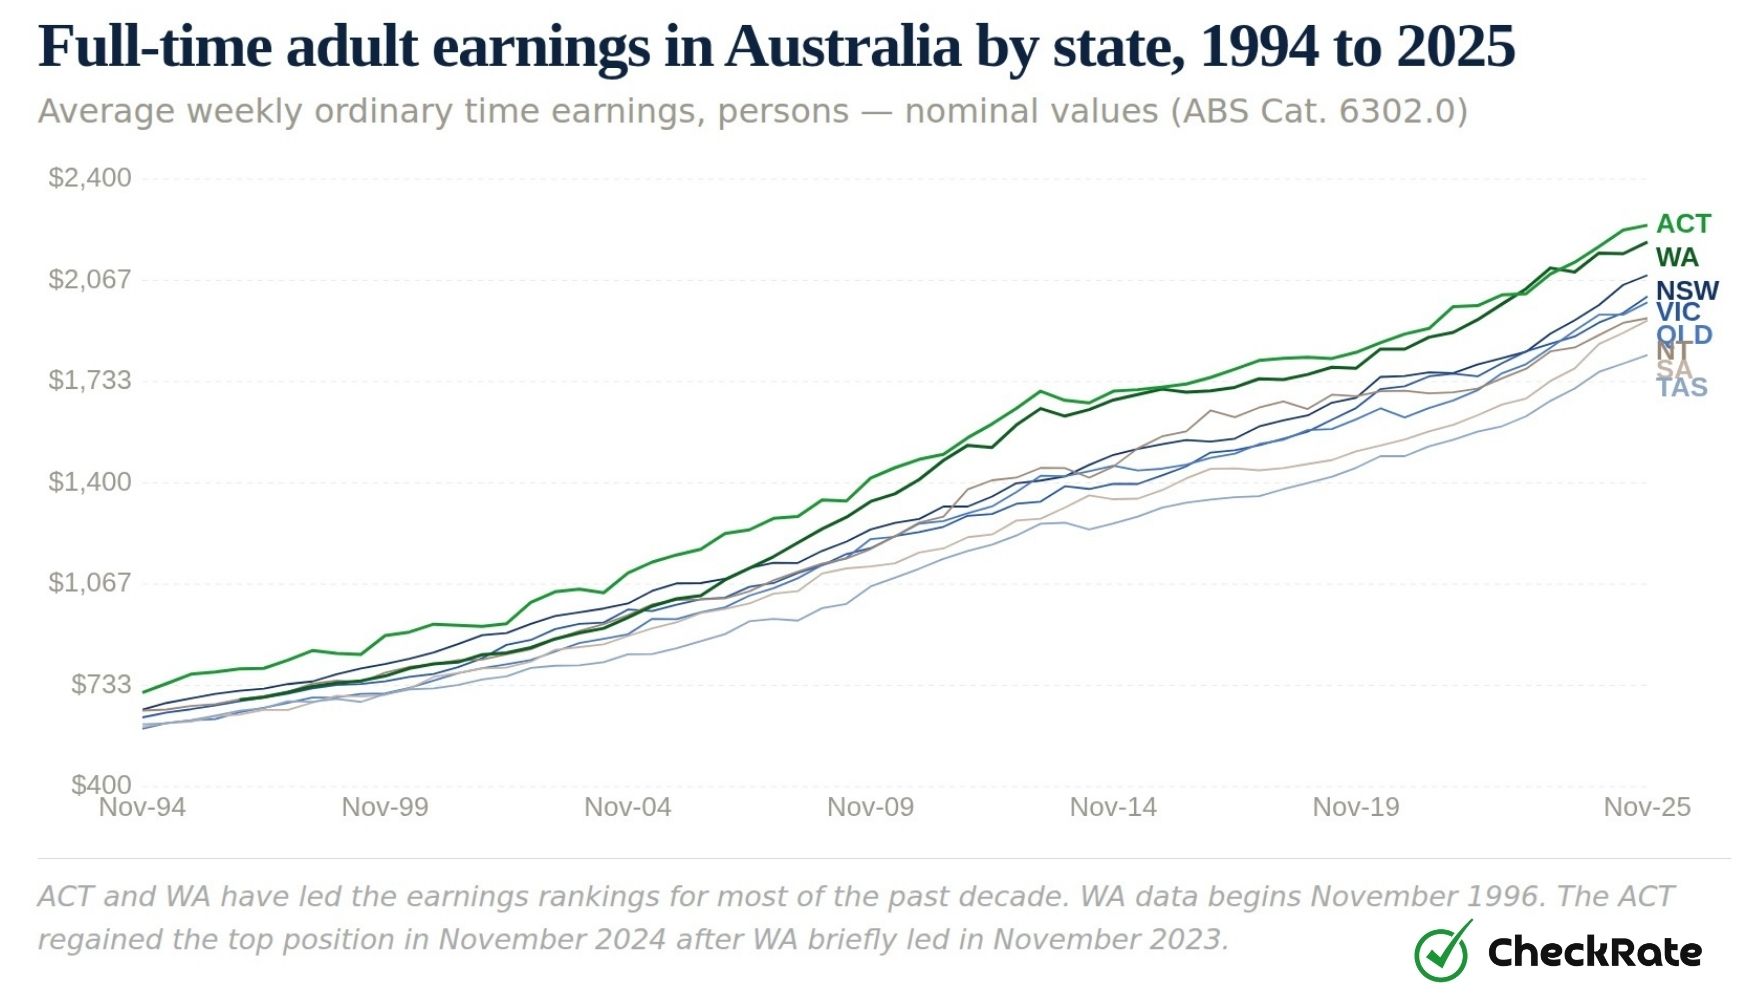
The 30-year earnings trend shows the ACT and WA as consistent leaders, while Tasmania has remained at the lower end. Most other states have broadly followed the national growth path, with some movement in rankings over time. WA's earnings rose sharply between about 2004 and 2013, during the mining investment boom. Since then, growth has been more moderate.
After inflation, the main story is how slowly wages moved through much of the 2010s. From around 2012 to 2020, real wages grew slowly, or barely moved, in several states.
Stronger wage growth returned between 2022 and 2025, but much of the increase was offset by higher inflation. This means the dollar value of wages rose, but purchasing power improved by less.
Gender pay gap by state and territory
The gender pay gap in full-time adult ordinary time earnings varies substantially across states.
Female full-time adults in Tasmania earned $1,814 a week in November 2025, only $11 less than the male figure of $1,825. That is a gap of less than 1%. Western Australia reported the widest gap. Female earners averaged $1,905 a week against $2,360 for males, a $454 weekly difference equivalent to 19.3%.
- Male
- Female
| State or territory | Male weekly | Female weekly | Gap ($) | Gap (%) |
|---|---|---|---|---|
| Western Australia | $2,360 | $1,905 | $454 | 19.3% |
| New South Wales | $2,184 | $1,936 | $248 | 11.4% |
| Victoria | $2,108 | $1,869 | $239 | 11.3% |
| Queensland | $2,077 | $1,855 | $222 | 10.7% |
| Northern Territory | $2,037 | $1,828 | $210 | 10.3% |
| South Australia | $1,991 | $1,845 | $146 | 7.3% |
| Australian Capital Territory | $2,306 | $2,183 | $123 | 5.3% |
| Tasmania | $1,825 | $1,814 | $11 | 0.6% |
| Australia (national) | $2,148 | $1,901 | $247 | 11.5% |
Tasmania recorded an unusually small gap between male and female full-time earnings. This may reflect a more even spread of occupations and a smaller concentration of male-dominated, high-paying industries. Western Australia had the widest gap, which is closely linked to the state's mining and resources workforce, where higher-paying roles are more heavily male.
The ACT recorded a gap of 5.3%, well below the national gap. This is likely linked to its large share of professional and public-sector roles, where pay structures can be more formal. South Australia also sat below the national gap at 7.3%, which may partly reflect a smaller concentration of resource-sector employment.
Nationally, female full-time adults earned $1,901 a week in November 2025, compared with $2,148 for males. That was a difference of $247 a week, or 11.5%.
Explore the data: full state and territory dashboard
References
- 1ABS Average Weekly Earnings, Australia, November 2025: full-time adult ordinary time earnings by state and territory, original series, November 2025 reference period. Cat. No. 6302.0.
- 2ABS Consumer Price Index, Australia, March 2026. Table 11: annual percentage change by capital city.
- 3ABS Jobs in Australia, 2022–23: LEED-based regional income data by suburb and local government area.
- 4ABS 2021 Census of Population and Housing: occupation, industry, income and educational attainment data by state and territory.
- 5ABS Wage Price Index, Australia, March Quarter 2026: quarterly wage growth rates by state and territory.
Data Snapshots