


Updated
- National average (annual)
- $86,000
- Projected annual earnings, all employees ($7,163/mth), Q1 2026
- Peak earning age group
- 45–54
- Projected $2,031/wk ($8,801/mth · $105,600/yr), Q1 2026
- Annual wage growth
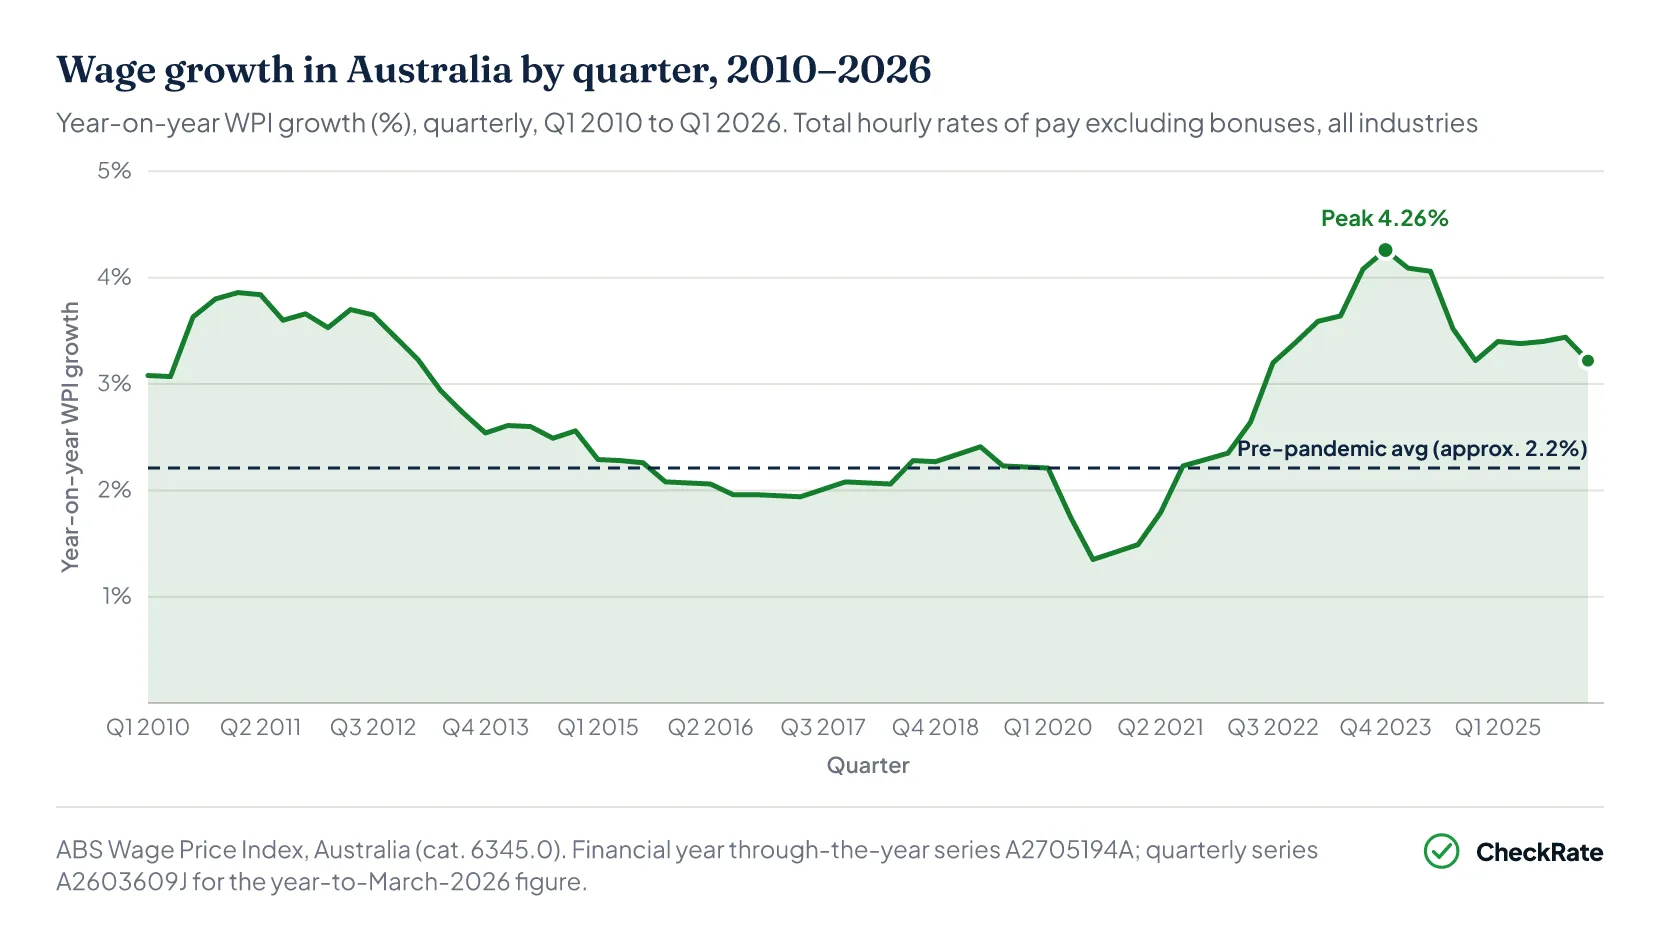
- 3.22%
- Year to March 2026 (WPI), easing from 4.1% in the year to June 2024
- Widest gender pay gap
- 14.6%
- Full-time workers aged 45 to 54 ($19,552/yr difference), May 2025
 Average salary by state and territory in Australia in 2026The national average for full-time adult ordinary time earnings was $2,051 a week in November 2025. That works out to about $106,657 a year on a 52-week basis.
 Average salary by occupation in AustraliaFull-time adult average weekly ordinary time earnings were $2,051.10 a week, or $106,657 a year, in November 2025. This is the main national benchmark for full-time adult earnings. It excludes overtim…
 Australian wages and wealth since 2000: why higher pay has not gone as farThe average full-time Australian worker earned $2,051.10 a week in ordinary-time wages in November 2025, equal to $106,657 a year. That was 157% higher than in November 2000, when the same measure was…
Section 01 · Earnings by age
Average earnings by age group in Australia
Australian employees earned an average of $1,611 per week in May 2025, or roughly $83,800 a year. This figure covers all employees, including full-time, part-time, permanent and casual workers across all industries and pay rates.
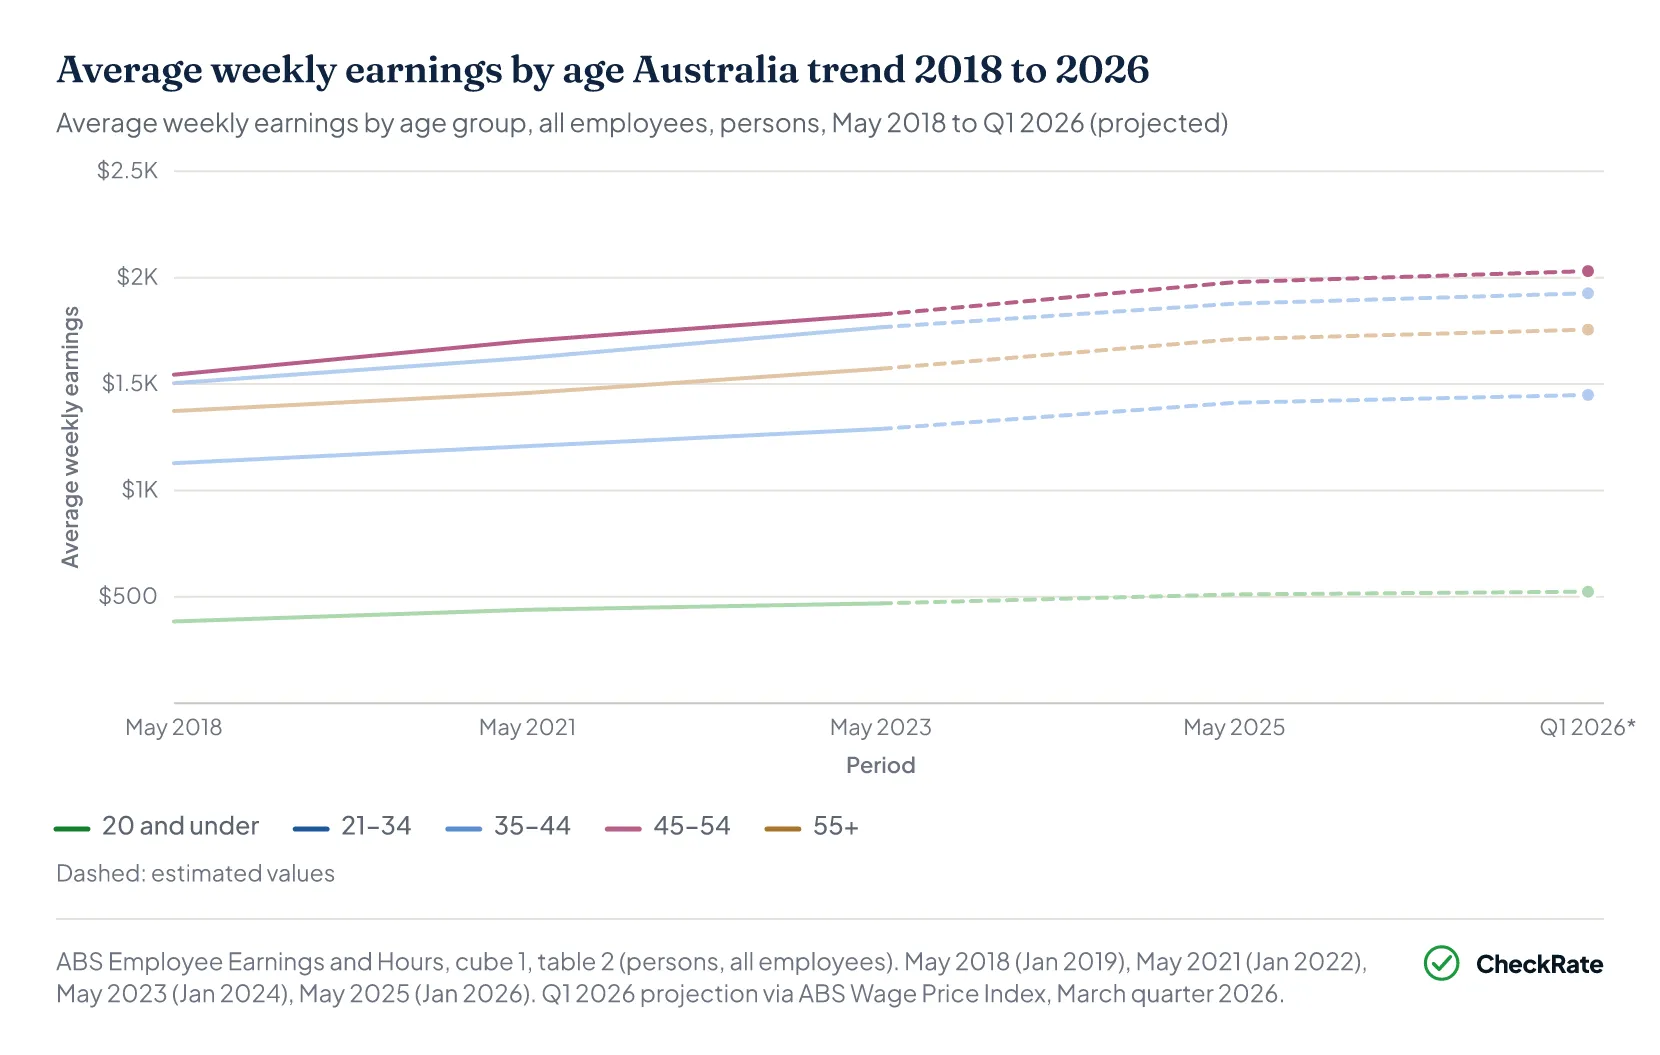
Earnings vary sharply by age. Workers aged 45 to 54 had the highest average earnings at $1,979 per week, or about $102,900 a year. Those aged 35 to 44 were close behind at $1,878 per week. Younger workers earned considerably less, with the 21 to 34 group averaging $1,412 per week and workers under 20 averaging $511 per week.
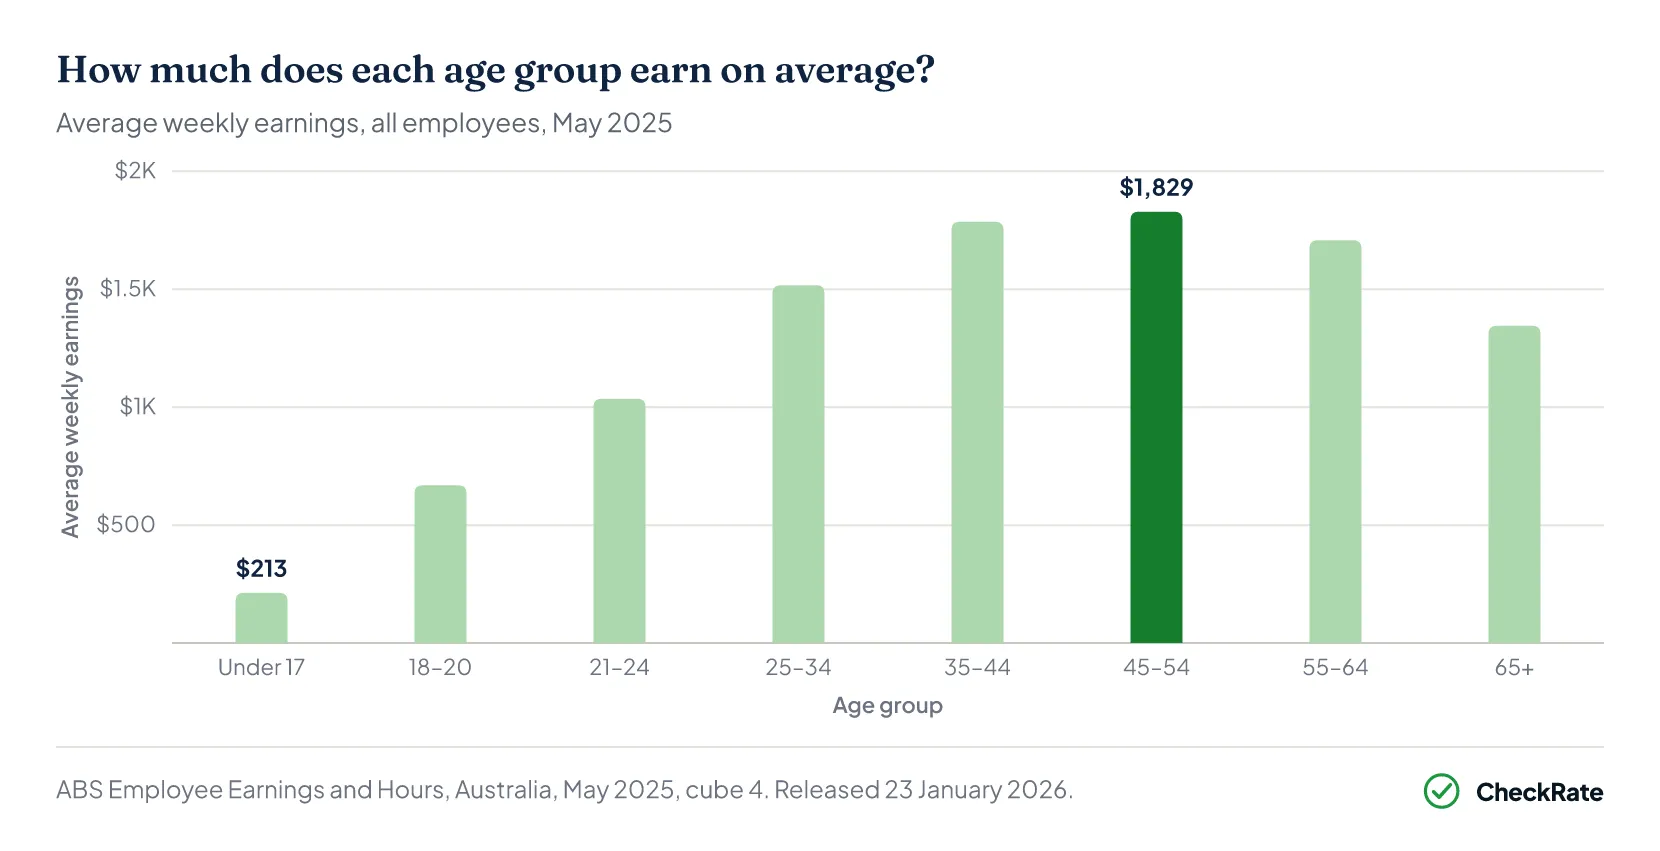
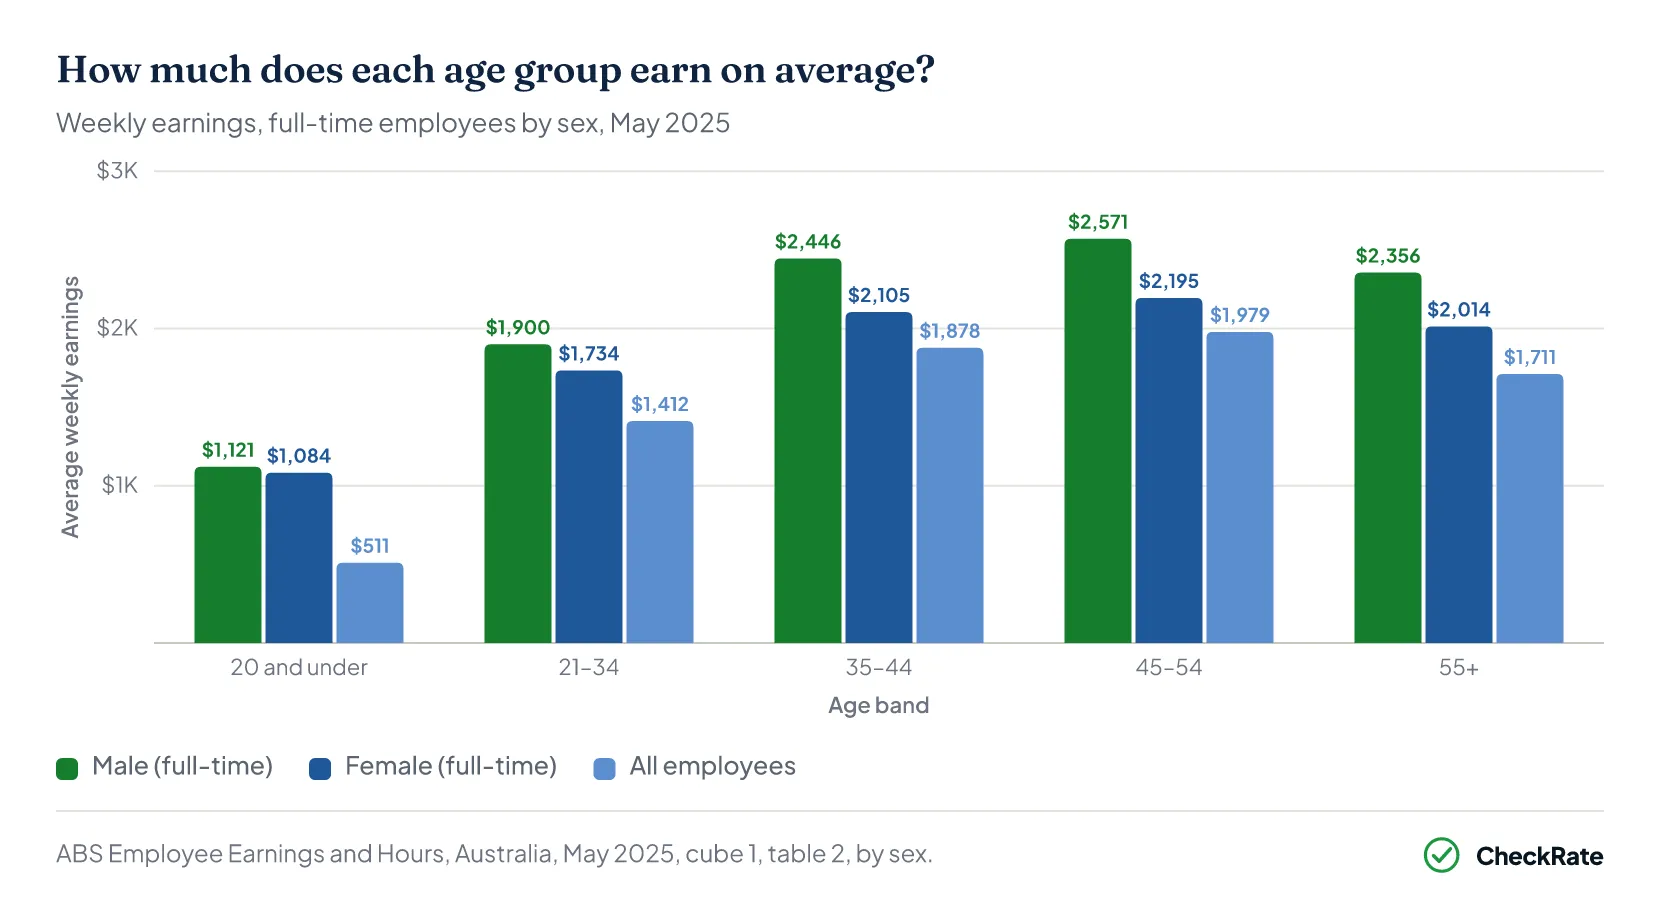
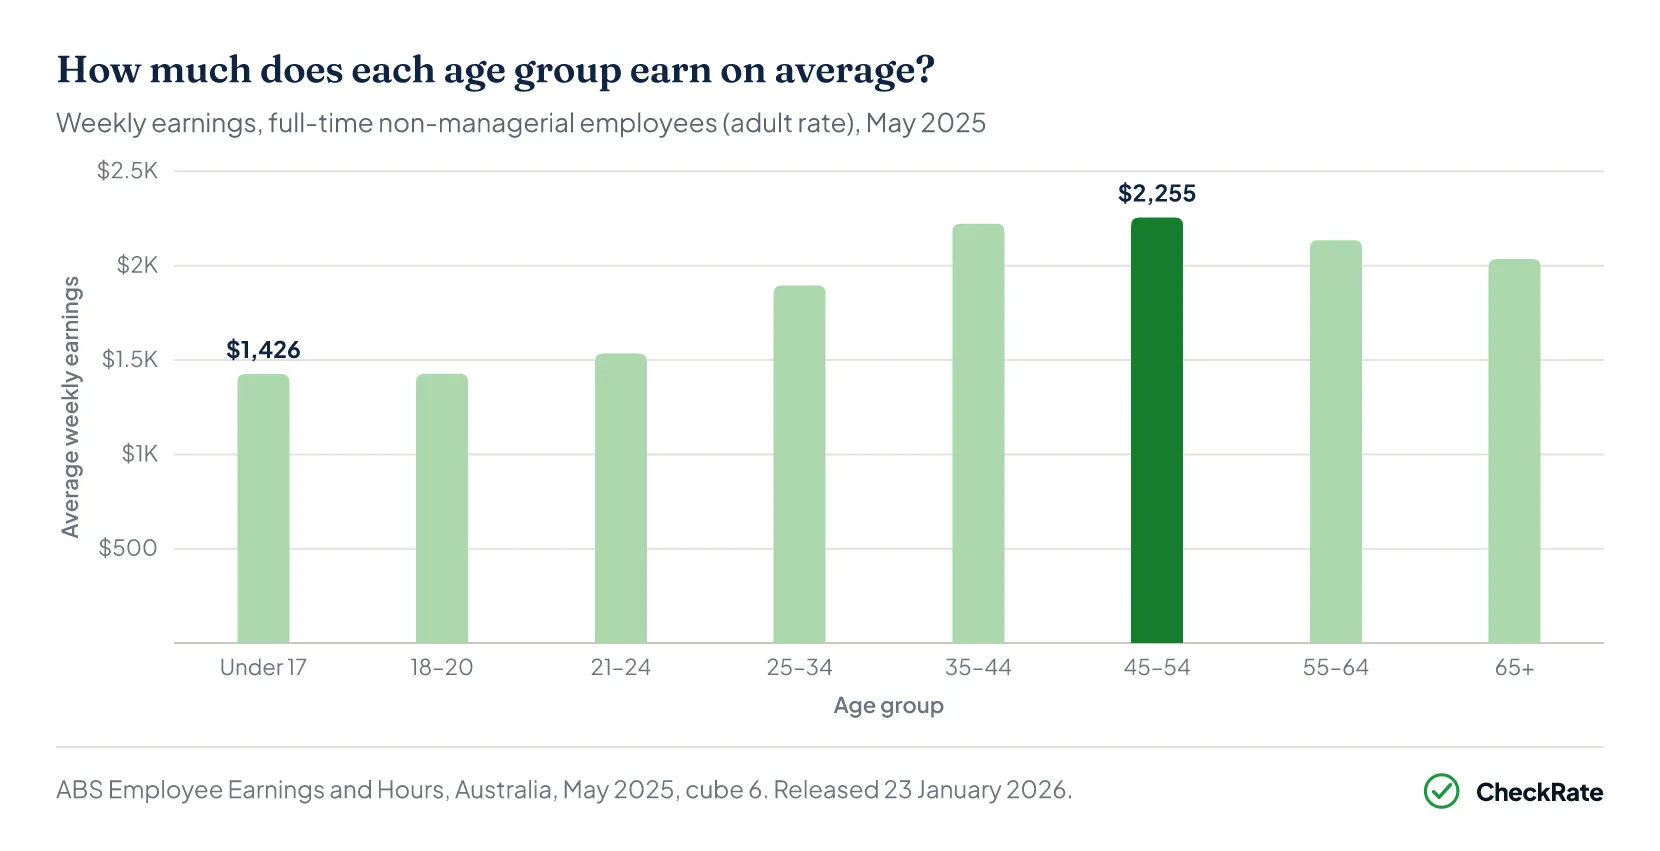
Annual figures are weekly earnings multiplied by 52; monthly figures are weekly earnings multiplied by 52 then divided by 12. “All employees” includes all employment types (ABS Employee Earnings and Hours survey, table 4). “Full-time only” covers full-time non-managerial employees paid at the adult rate (table 6). The 45 to 54 bar is highlighted as the peak earning age group.
| Age group | Median (wk) | FT avg (wk) | PT avg (wk) | All avg (wk) | Monthly | Annual |
|---|---|---|---|---|---|---|
| 20 and under | $353 | $1,111 | $368 | $511 | $2,213 | $26,600 |
| 21 to 34 | $1,330 | $1,831 | $826 | $1,412 | $6,120 | $73,400 |
| 35 to 44 | $1,717 | $2,310 | $1,054 | $1,878 | $8,136 | $97,600 |
| 45 to 54 ★ | $1,732 | $2,417 | $1,090 | $1,979 | $8,575 | $102,900 |
| 55 and over | $1,480 | $2,224 | $995 | $1,711 | $7,416 | $89,000 |
| All ages | $1,436 | $2,131 | $873 | $1,611 | $6,981 | $83,800 |
Source · ABS Employee Earnings and Hours survey, May 2025 — median from table 3 (all employees); FT/PT/all-employee averages from table 1
Section 02 · Q1 2026 projection
What do Australian workers earn in 2026?
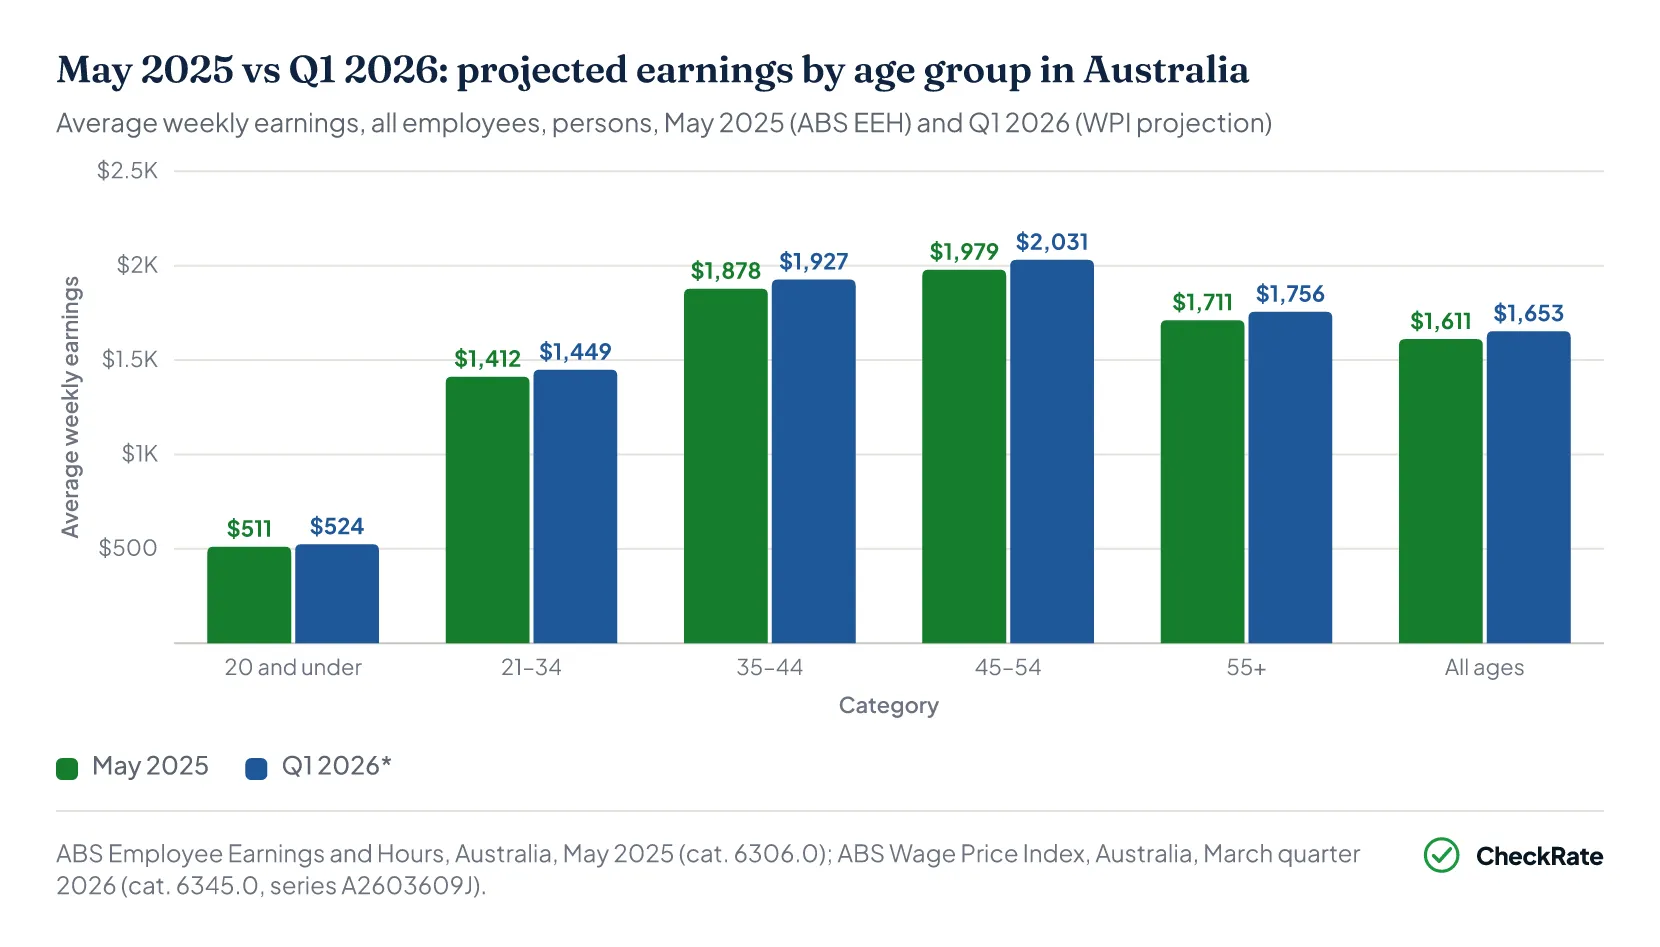
Australian employees are estimated to earn an average of $1,653 per week in Q1 2026, or roughly $86,000 a year.
Earnings remain highest for workers aged 45 to 54, at $2,031 per week, or about $105,600 a year.
At the lower end, workers under 20 average an estimated $524 per week, or about $27,300 a year. Among full-time non-managerial employees, the 45 to 54 age group reaches $2,314 per week or about $120,300 a year.
These are projected estimates, not direct survey results. The ABS Employee Earnings and Hours survey runs every two years, with the most recent release covering May 2025. To produce 2026 figures, those results have been updated using the Wage Price Index (WPI), an official measure that tracks wage changes across a fixed set of jobs in all industries.
The WPI increased by 2.63 per cent from June 2025 to March 2026, and that rate has been applied across all age groups to arrive at the Q1 2026 estimates.
| Age group | May 2025 (wk) | May 2025 (annual) | Q1 2026 proj. (wk) | Q1 2026 proj. (annual) | Change |
|---|---|---|---|---|---|
| 20 and under | $511 | $26,600 | $524 | $27,300 | +2.5% |
| 21 to 34 | $1,412 | $73,400 | $1,449 | $75,400 | +2.6% |
| 35 to 44 | $1,878 | $97,600 | $1,927 | $100,200 | +2.6% |
| 45 to 54 ★ | $1,979 | $102,900 | $2,031 | $105,600 | +2.6% |
| 55 and over | $1,711 | $89,000 | $1,756 | $91,300 | +2.6% |
| All ages | $1,611 | $83,800 | $1,653 | $86,000 | +2.6% |
Source · ABS Employee Earnings and Hours, Australia, May 2025; ABS Wage Price Index, March quarter 2026
Wage growth, as measured by the WPI, cooled to 3.22 per cent in the year to March 2026, down from 4.1 per cent in the year to June 2024.
That is the slowest annual pace since 2022 and points to a labour market that has continued to ease after the post-pandemic tightening. Wage growth remains above the pre-COVID average of around 2% to 2.5% a year, but it has slowed from the faster gains recorded in 2023 and 2024.
Section 03 · Peak earnings
At what age do Australians reach peak earnings?
Workers aged 45 to 54 have been Australia’s highest-earning age group in every national earnings survey since at least 2018.
In May 2025, this group averaged $1,979 per week across all employees, or $8,575 a month and $102,900 a year. Among full-time employees, the average was $2,417 per week, or $10,473 a month and $125,700 a year.
Pay generally rises through a worker’s 20s and 30s as experience builds and people move into more senior roles. It then levels off in the 45 to 54 age group before falling by around 14% for workers aged 55 and over. This partly reflects older workers being more likely to move into part-time arrangements or step back from higher-intensity roles.
Average weekly earnings increased by around 25% in the seven years to May 2025. Workers under 20 recorded the fastest growth, rising 33.1% from $384 to $511 per week, likely reflecting successive minimum wage increases and changes to junior pay rates.
Among adult age groups, workers aged 21 to 34 recorded the strongest recent growth, rising 9.5% from $1,289 per week in May 2023 to $1,412 per week in May 2025.
Section 04 · Gender pay gap
How much does the gender pay gap vary by age?
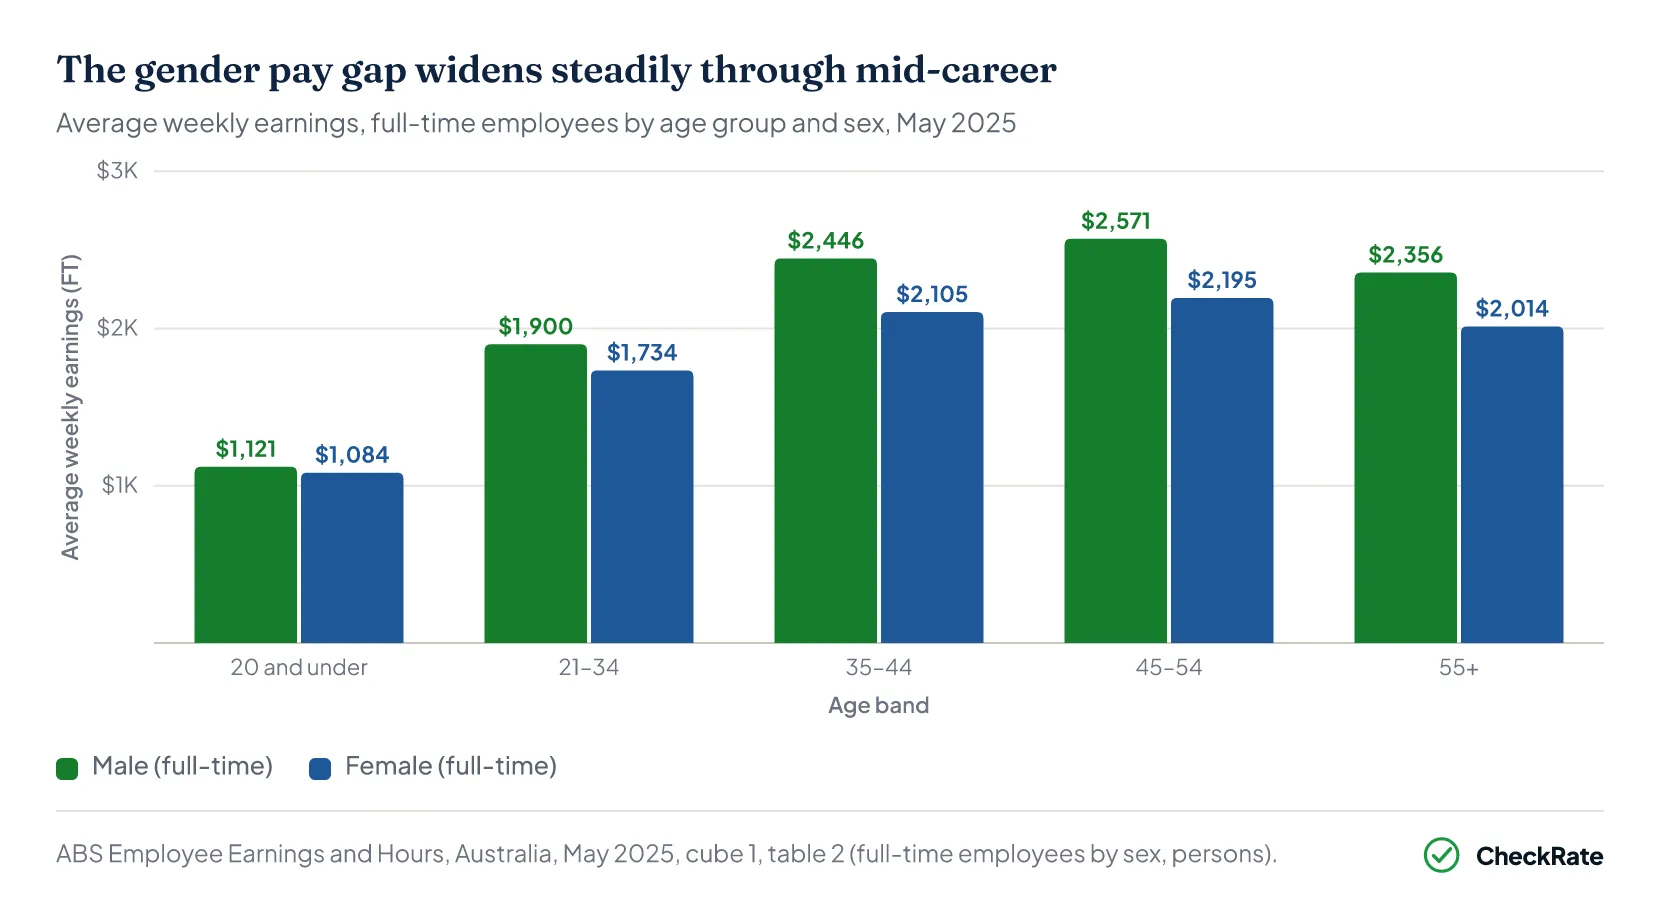
Among full-time employees, the gender pay gap is narrowest for younger workers and widens through mid-career. Workers under 20 had a gap of 3.3% in May 2025, with male full-time employees averaging $1,121 per week compared with $1,084 for females. That is a difference of $37 per week, or about $1,924 a year.
By the 35 to 44 age group, that gap had widened to 14.0%, equal to $341 per week or $17,732 a year. It peaked in the 45 to 54 age group at 14.6%, or $376 per week and $19,552 a year.
Part of this reflects differences in occupation, seniority, industry and working patterns across age groups. The widening from early to mid-career is also consistent with research on the “child penalty”, where women’s earnings are more likely to be affected after parenthood.
Why is the pay gap so small for workers under 20?
Most workers under 20 are paid under award or junior pay rates, which are legally set and apply regardless of gender. There is also less room for individual pay negotiation, and younger workers are less likely to receive bonuses, allowances or seniority-based pay that can widen gaps in higher-paid roles. National data shows the under-20 full-time earnings gap is $37 per week, or $1,924 a year. By age 35 to 44, the gap rises to $341 per week, or $17,732 a year.
Does having children affect earnings differently for men and women?
Research on the “child penalty” shows that women’s earnings are more likely to fall after having children and may not fully recover. This can reflect time out of the workforce, reduced hours, part-time work and slower career progression. These effects can build over time, which helps explain why the gender pay gap widens through the 35 to 44 age group and remains elevated in later working years.
Is the gender pay gap closing over time?
In percentage terms, yes, though slowly. Tax office data shows the gender gap in average income narrowed from 32.0% in 2014-15 to 28.0% in 2022-23. Women’s median taxable income increased by 31% over that period, rising from $37,041 to $48,533. Men’s median taxable income increased by 26%, from $51,682 to $65,051. However, the dollar gap in retirement superannuation balances has widened over the same period.
Section 05 · Graduate salaries
Graduate starting salaries vs mid-career pay in Australia
The median full-time salary for recent undergraduates was $75,000 a year or $6,250 a month, measured four to six months after completing their degree. Postgraduate coursework graduates reported a median of $100,000, while research graduates reported $104,400.
Recent bachelor’s graduates typically earn slightly below the national full-time average for workers their age. Full-time employees aged 21 to 24 averaged $79,768 a year across all qualifications and industries. Postgraduate coursework graduates, with a median salary of $100,000, sit just above the full-time average for workers aged 25 to 34, at $98,540 a year.
The field of study makes a substantial difference. Engineering and mining graduates report median starting salaries well above $90,000, while arts and humanities graduates often report below $65,000. The overall medians combine all fields, so they should be read as broad benchmarks rather than expected salaries for every graduate.
- Bachelor’s degree graduates ($75,000): The national average for all employees aged 21 to 24 is $53,872 a year; the full-time average is $79,768 a year. Recent bachelor’s graduates typically sit below the full-time average for their age, reflecting early-career roles and the wide range of outcomes across different fields of study.
- Master’s degree graduates ($100,000): Master’s graduates sit just above the national full-time average for workers aged 25 to 34 ($98,540 a year). Postgraduate coursework graduates may already have work experience or be moving into more specialised roles.
- PhD and research graduates ($104,400): Research graduates are typically older and entering specialised roles. STEM and medical research graduates tend to sit well above this median; social sciences and humanities graduates tend to sit below.
Section 06 · Earnings lifecycle
How income changes over a working life in Australia
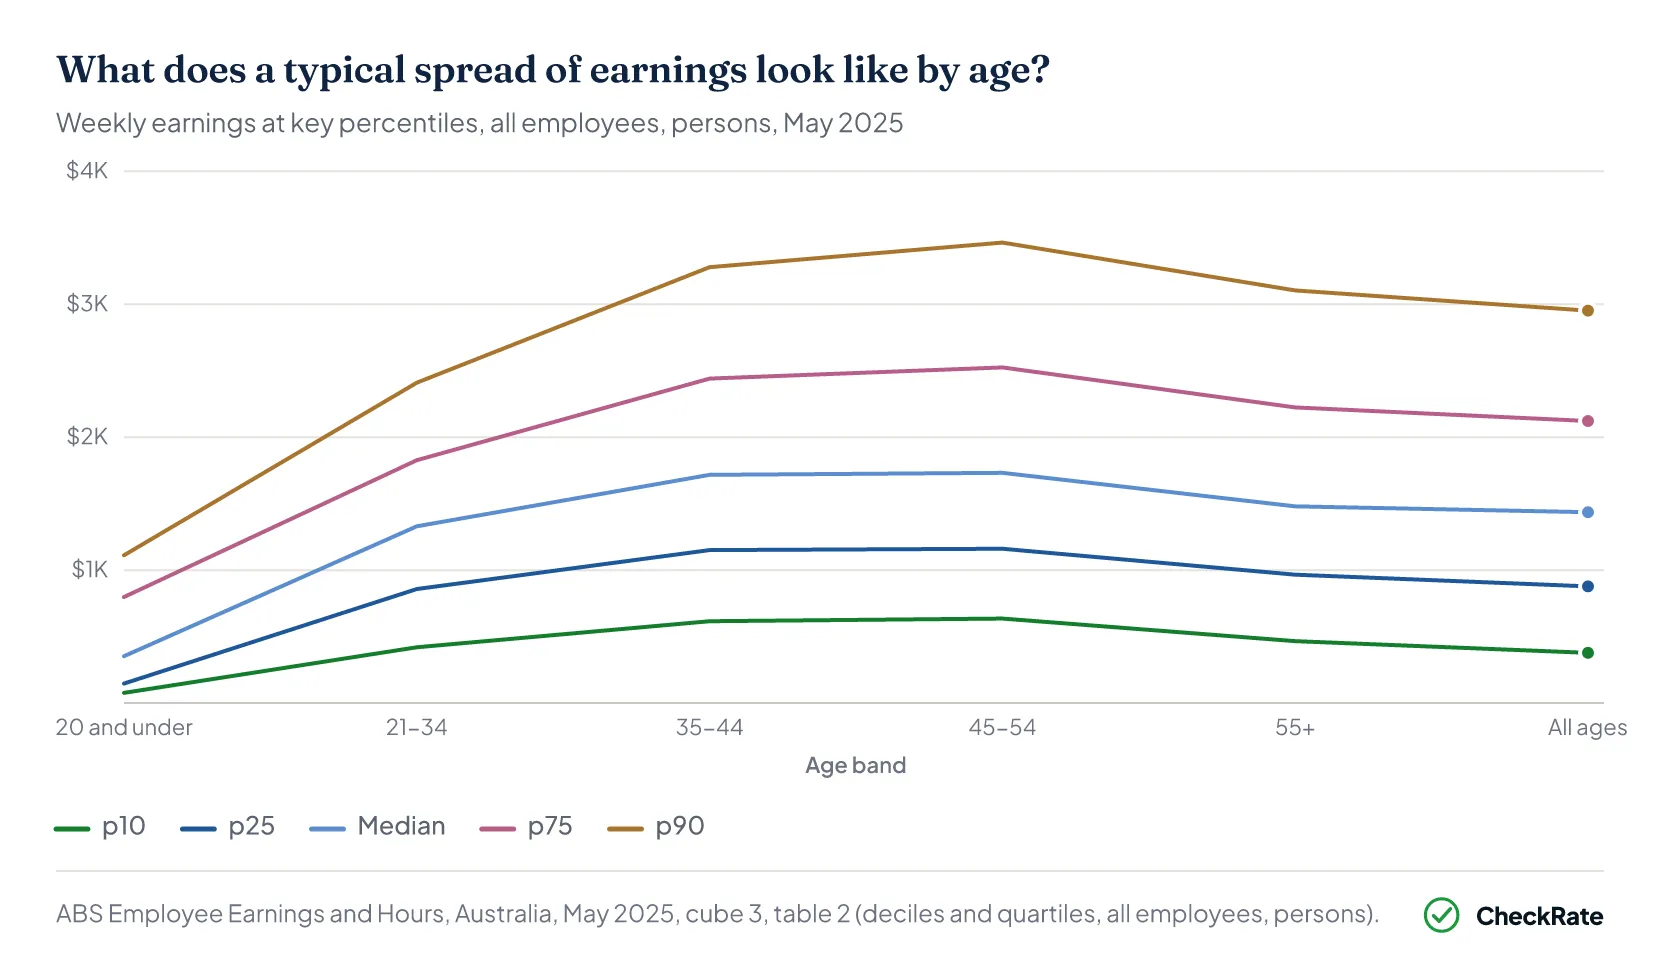
Averages only tell part of the story. Among workers aged 45 to 54, average earnings were $1,979 per week, or $8,575 a month. But earnings within the same age group varied widely, from $636 per week at the 10th percentile to $3,464 per week at the 90th percentile.
That means the gap between lower and higher earners in this age group was almost $147,000 a year. This is more than the entire average annual earnings of a worker aged under 20.
The earnings spread widens with age. For workers under 20, the gap between the lowest 10% and highest 10% of earners was around $54,000 a year. By ages 35 to 44, it had grown to $138,476. By ages 45 to 54, it reached $147,056.
In these older age groups, the average also starts to move further away from the median. Among workers aged 45 to 54, average earnings were $1,979 per week, while median earnings were $1,732 per week. That is a gap of $247 per week, or $12,844 a year.
This shows how a smaller number of high earners can pull the average above what many workers in the same age group actually earn.
| Earnings distribution by age — full table | ||||||
|---|---|---|---|---|---|---|
| Age group | Bottom 10% (wk) | Median (wk) | Average (wk) | Avg vs median gap | Top 10% (wk) | Earnings spread (annual) |
| 20 and under | $77 | $353 | $511 | $158/wk | $1,112 | $53,820 |
| 21 to 34 | $420 | $1,330 | $1,412 | $82/wk | $2,410 | $103,480 |
| 35 to 44 | $616 | $1,717 | $1,878 | $161/wk | $3,279 | $138,476 |
| 45 to 54 | $636 | $1,732 | $1,979 | $247/wk | $3,464 | $147,056 |
| 55 and over | $466 | $1,480 | $1,711 | $231/wk | $3,104 | $137,176 |
| All ages | $378 | $1,436 | $1,611 | $175/wk | $2,952 | $133,848 |
Source · ABS Employee Earnings and Hours survey, May 2025, table 3 (all employees)
Section 07 · Superannuation
Average superannuation balances by age in Australia
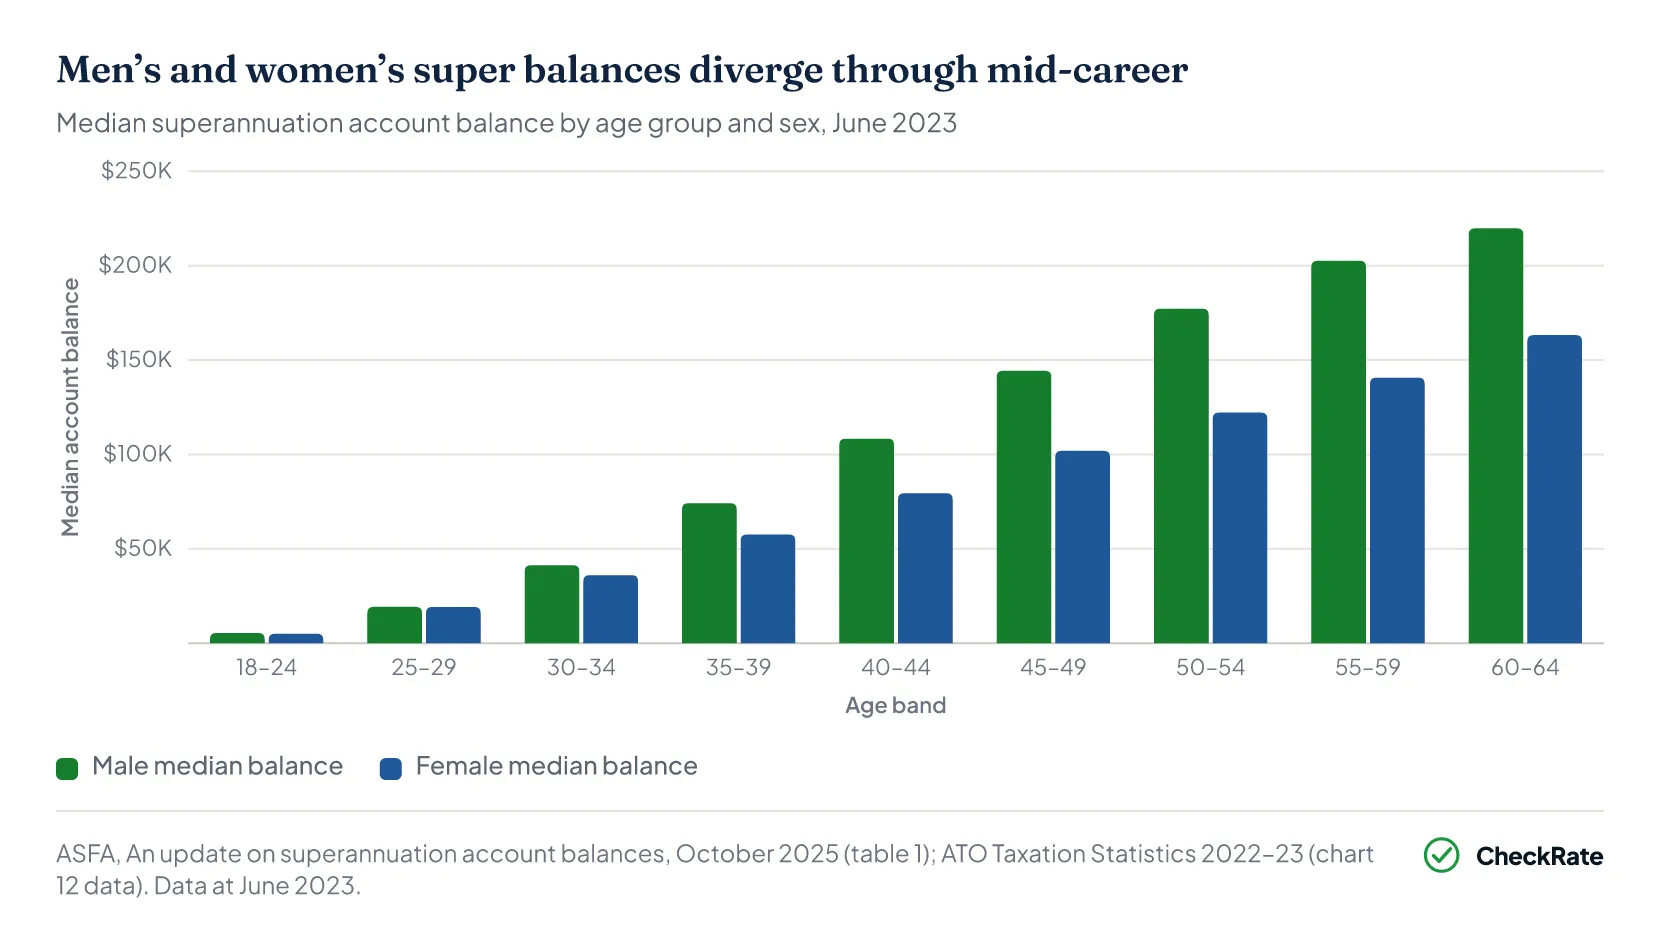
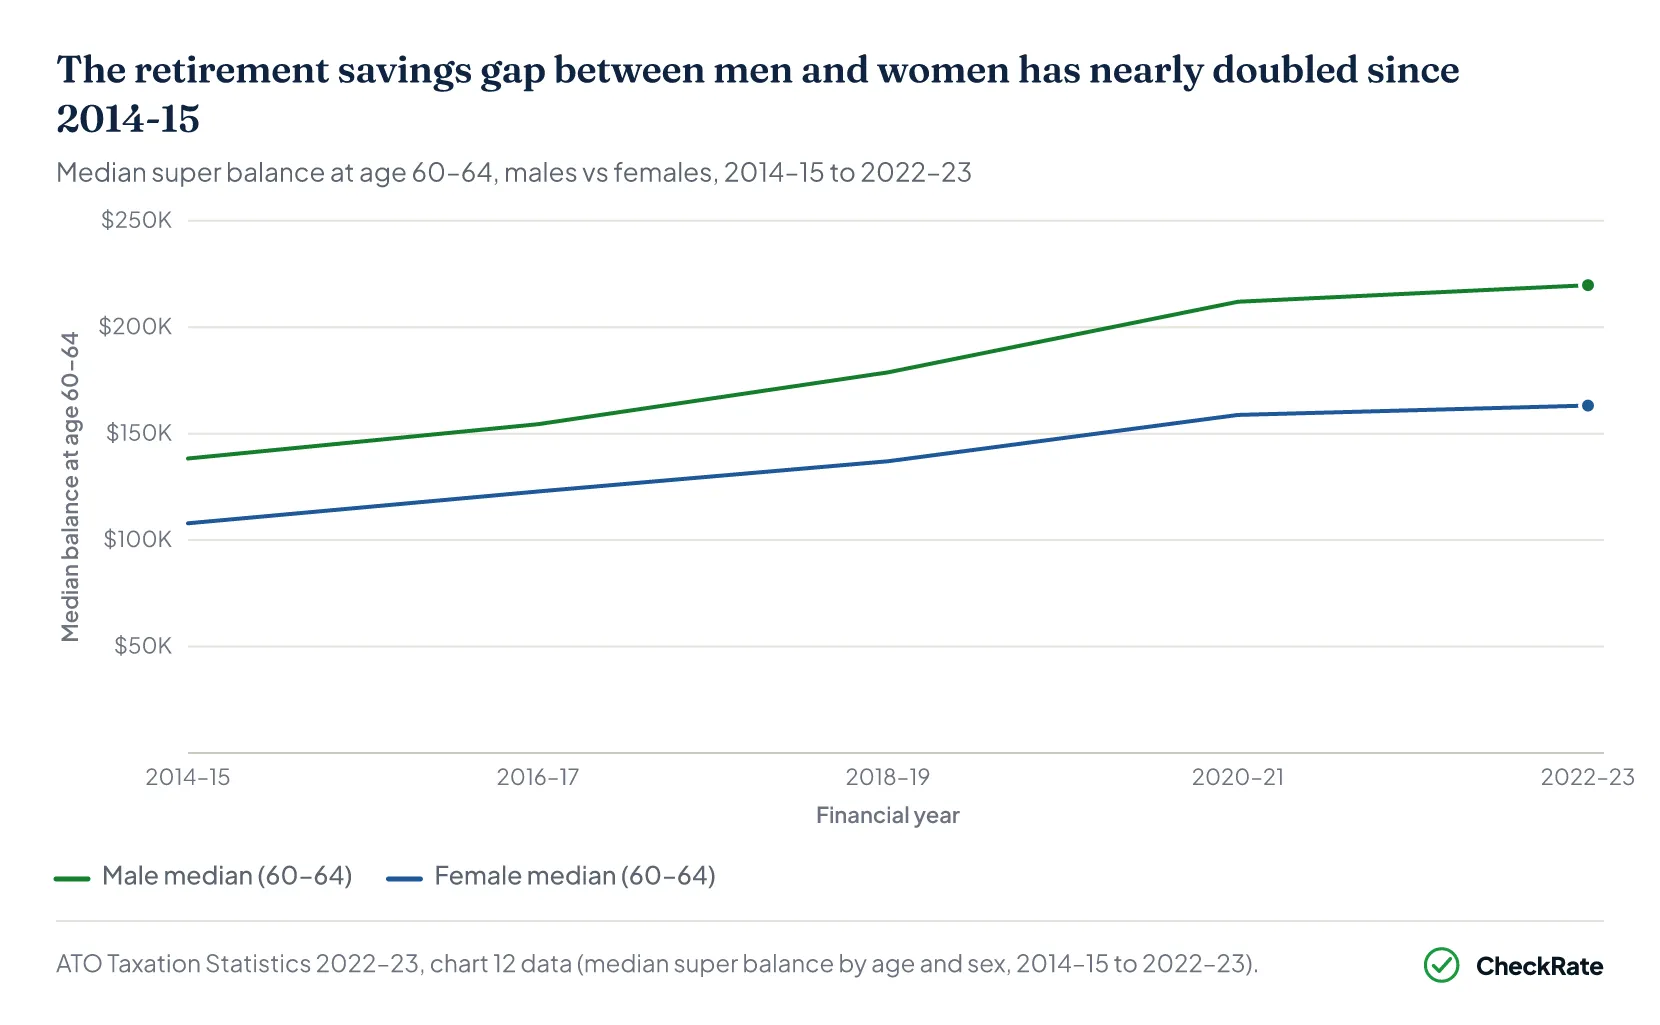
The earnings gap between men and women can compound over a working life into a superannuation gap that widens over time. At June 2023, the median super balance for men aged 60 to 64 was $219,773, compared with $163,218 for women. That is a difference of $56,555 (25.7%).
Super balances build with age through ongoing contributions and investment returns. The Superannuation Guarantee rate was 10.5% when this data was collected in June 2023. It rose to 12% from 1 July 2025, meaning current workers now receive a higher contribution rate and will accumulate more over time.
The Australian Prudential Regulation Authority’s (APRA) quarterly superannuation industry publication recorded $2.83 trillion in member assets across approximately 23.4 million member accounts at December 2025.
The gender gap is also visible in account ownership. Around 23% of women aged 60 to 64 have no super at all, compared with 13% of men. Among those who do have super, the spread is wide: 25% of men aged 60 to 64 have more than $504,347, while 25% of women in the same age group have less than $49,199.
The dollar gap at age 60 to 64 has nearly doubled over eight years. In 2014-15, men at this age had a median balance of $138,337 and women $107,897, a gap of $30,440.
By 2022-23, that gap had grown to $56,555. Both groups made gains in absolute terms, with men’s median balance rising 59% and women’s rising 51%. However, because men’s higher career earnings translate into larger contributions over time, the gap between them has widened.
What are the average super balances by age?
National data provides useful benchmarks for comparing super balances by age. At ages 30 to 34, the median super balance is around $41,268 for men and $36,016 for women. By ages 45 to 49, the median rises to $144,272 for men and $101,888 for women. At ages 60 to 64, the median balance reaches $219,773 for men and $163,218 for women. ASFA estimates that a 30-year-old with $30,000 in super, earning the median wage, could reach about $610,000 by retirement under its modelling assumptions. This sits above ASFA’s estimated $595,000 balance for a comfortable single-person retirement. These figures are benchmarks, not personalised retirement targets. Super balances vary by income, time out of work, contributions, fees and investment returns.
Why does the gender super gap grow with age even though the earnings gap exists from early career?
The gap compounds over time. Career breaks, caregiving responsibilities and periods of part-time work can reduce super contributions, while also reducing the investment returns that would have been earned on those contributions. These effects can build across decades of working life. If women have lower average earnings, take more time out of paid work, or return to lower-paid or part-time roles, their super balances may grow more slowly over time. Policy changes, including super on paid parental leave from 1 July 2025 and the removal of the $450 per month earnings threshold, may help reduce this effect for younger workers over time.
What is a comfortable retirement balance according to ASFA?
ASFA’s Comfortable Retirement Standard for 2024-25 estimates a single person needs approximately $595,000 in super at age 67, and a couple needs approximately $690,000. A “modest” lifestyle in private rental requires $340,000 for a single person. Around 30% of Australians retire with enough to meet the comfortable standard, a proportion expected to rise as the 12% Superannuation Guarantee rate takes effect across more working years.
What happened to the Superannuation Guarantee rate?
The Superannuation Guarantee rate reached 12% on 1 July 2025, up from 11.5% in 2024-25 and 10.5% in 2022-23. There are no further legislated increases beyond 12%. The rate was stalled at 9% and then 9.5% for extended periods, meaning many Australians approaching retirement accumulated super under lower contribution rates than current workers. APRA recorded $2.83 trillion in member assets across approximately 23.4 million member accounts at December 2025. It also reported that 78% of Australians held a single super account, up from 74% in 2020.
Section 08 · Salary calculator
Where does a salary sit in its age group?
Select an age group and enter an annual salary to see how it compares with other Australian workers. Based on ABS Employee Earnings and Hours, May 2025 (all employees).
Salary by age calculator
See how your salary compares with other workers your age — your percentile and the share who earn less and more.
References
- ABS Employee Earnings and Hours, Australia, May 2025 · Australian Bureau of Statistics
- ABS Employee Earnings and Hours, Australia — historical releases (May 2018, May 2021, May 2023) · Australian Bureau of Statistics
- ABS Wage Price Index, Australia · Australian Bureau of Statistics
- ASFA Superannuation Account Balances Paper, December 2025 · superannuation.asn.au
- APRA Quarterly Superannuation Industry Publication, December 2025 · apra.gov.au
- QILT Graduate Outcomes Survey 2024 · qilt.edu.au
- ATO, Taxation statistics 2022-23, Individuals Table 16: percentile distribution of taxable individuals, by taxable income and sex · ato.gov.au
- WGEA Ages and Wages 2025 (2024 Employer Census) · wgea.gov.au