


Updated
- Full-time adult mean annual earnings
- $106,657
- Based on $2,051.10 a week, November 2025. The national full-time benchmark.
- Median annual earnings, all employees
- $74,100
- Based on $1,425 a week, August 2025. Half of workers earned less than this amount.
- Annual wage growth, year to March 2026
- 3.3%
- Wage Price Index. Easing from a peak of 4.3% in late 2023.
- Highest-paid industry, annual equivalent
- $165,069
- Mining averaged $3,174.40 a week in full-time ordinary time earnings, November 2025.
 Average salary in Australia 2026: wages, median pay and weekly earningsThe average full-time adult worker in Australia earned $2,051.10 per week in base pay, known as ordinary time earnings, as at November 2025. That is equal to $106,657 per year. This is the most widely…
 What is considered a high income in Australia in 2026?Australia doesn't have a single official definition of a high income. Three separate government thresholds each serve a different purpose, ranging from $101,000 for singles under the Medicare levy sur…
 Average salary by state and territory in Australia in 2026The national average for full-time adult ordinary time earnings was $2,051 a week in November 2025. That works out to about $106,657 a year on a 52-week basis.
Section 01 · National average
What is the average salary in Australia?
Full-time adult average weekly ordinary time earnings were $2,051.10 a week, or $106,657 a year, in November 2025. This is the main national benchmark for full-time adult earnings. It excludes overtime and is calculated as a mean, which means it can be lifted by higher earners.
Median weekly earnings in a main job were lower, at $1,425 a week, or $74,100 a year, in August 2025. That means the median sits $32,557 a year below the full-time adult average. The gap shows how higher earners can pull the mean above the middle of the earnings distribution.
The broader all-employees average was $1,562.40 a week, or $81,245 a year, in November 2025. This figure includes full-time, part-time and casual workers, so it sits below the full-time adult benchmark.
| Australian earnings benchmarks | |||
|---|---|---|---|
| Measure | Source and period | Weekly | Annual (est.) |
| Full-time adult average weekly ordinary time earnings | AWE, Nov 2025, persons, seasonally adjusted | $2,051.10 | $106,657 |
| Full-time adult average weekly total earnings (incl. overtime) | AWE, Nov 2025, persons, original | $2,129.00 | $110,708 |
| All employees average weekly total earnings | AWE, Nov 2025, persons, original | $1,562.40 | $81,245 |
| Median weekly earnings, main job | Employee Earnings, Aug 2025, persons | $1,425.00 | $74,100 |
| Median hourly earnings, main job | Employee Earnings, Aug 2025, persons | $42.90/hr | — |
Section 02 · Earnings by occupation group
Which occupations earn the highest salaries in Australia?
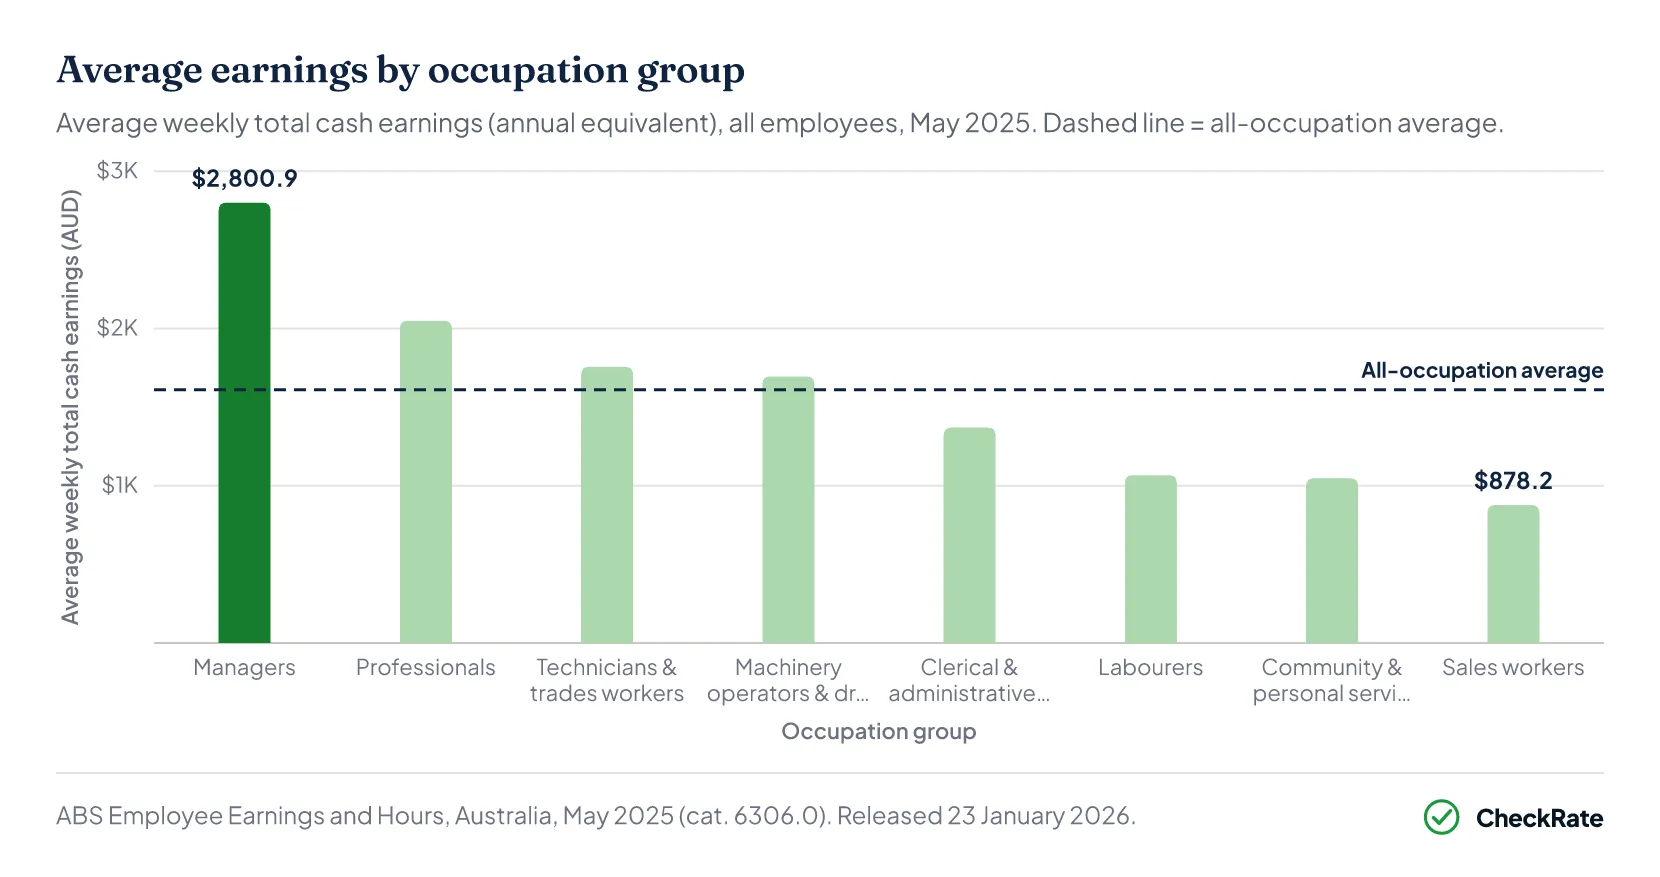
Managers averaged $2,800.90 a week or $145,647 a year in May 2025. This is the highest average earnings figure of any major occupation group. Sales workers averaged $878.20 a week or $45,666 a year, the lowest. The gap between the two groups was almost $100,000 a year.
Four of the eight major occupation groups sit above the all-occupation average of $1,611.10 a week. These are managers, professionals, technicians and trades workers, and machinery operators and drivers. Clerical and administrative workers, labourers, community and personal service workers, and sales workers are below the average.
Professionals are the largest group at 3.18 million employees, yet they earned $751.30 a week less than managers on average. Managers, at 1.27 million employees, are a considerably smaller group.
Section 03 · Highest and lowest-paying occupations
Which occupations are the highest and lowest paid in Australia?
At the sub-major occupation level, the gap between the highest and lowest-paid groups is wider. Chief executives, general managers and legislators record the highest median weekly earnings, at $3,223 a week, or $167,596 a year. Food preparation assistants record the lowest, at $448 a week, or $23,296 a year. The difference between these two groups is $2,775 a week, or more than $144,000 a year.
All figures in this section are medians: half of workers in each group earn more than the stated amount, and half earn less.
Highest-paying occupations
- Chief executives, general managers and legislators
$3,223/wk · median · $167,596 per year
- Specialist managers
$2,310/wk · median · $120,120 per year
- ICT professionals
$2,300/wk · median · $119,600 per year
Lowest-paying occupations
- Food preparation assistants
$448/wk · median · $23,296 per year
- Hospitality workers
$556/wk · median · $28,912 per year
- Sales assistants and salespersons
$631/wk · median · $32,812 per year
- Sales support workers
$661/wk · median · $34,372 per year
Source · Figures are median weekly earnings in main job; annual equivalents are weekly multiplied by 52. ABS Employee Earnings, Australia, August 2025 (cat. 6310.0).
Several of the lowest-paid groups have a high share of part-time or casual workers, which can lower median weekly earnings even where hourly rates are award-regulated. This is most visible in food preparation, hospitality and retail, where shorter shifts and casual work are common.
Section 04 · Earnings by industry
Which industries have the highest average salaries in Australia?
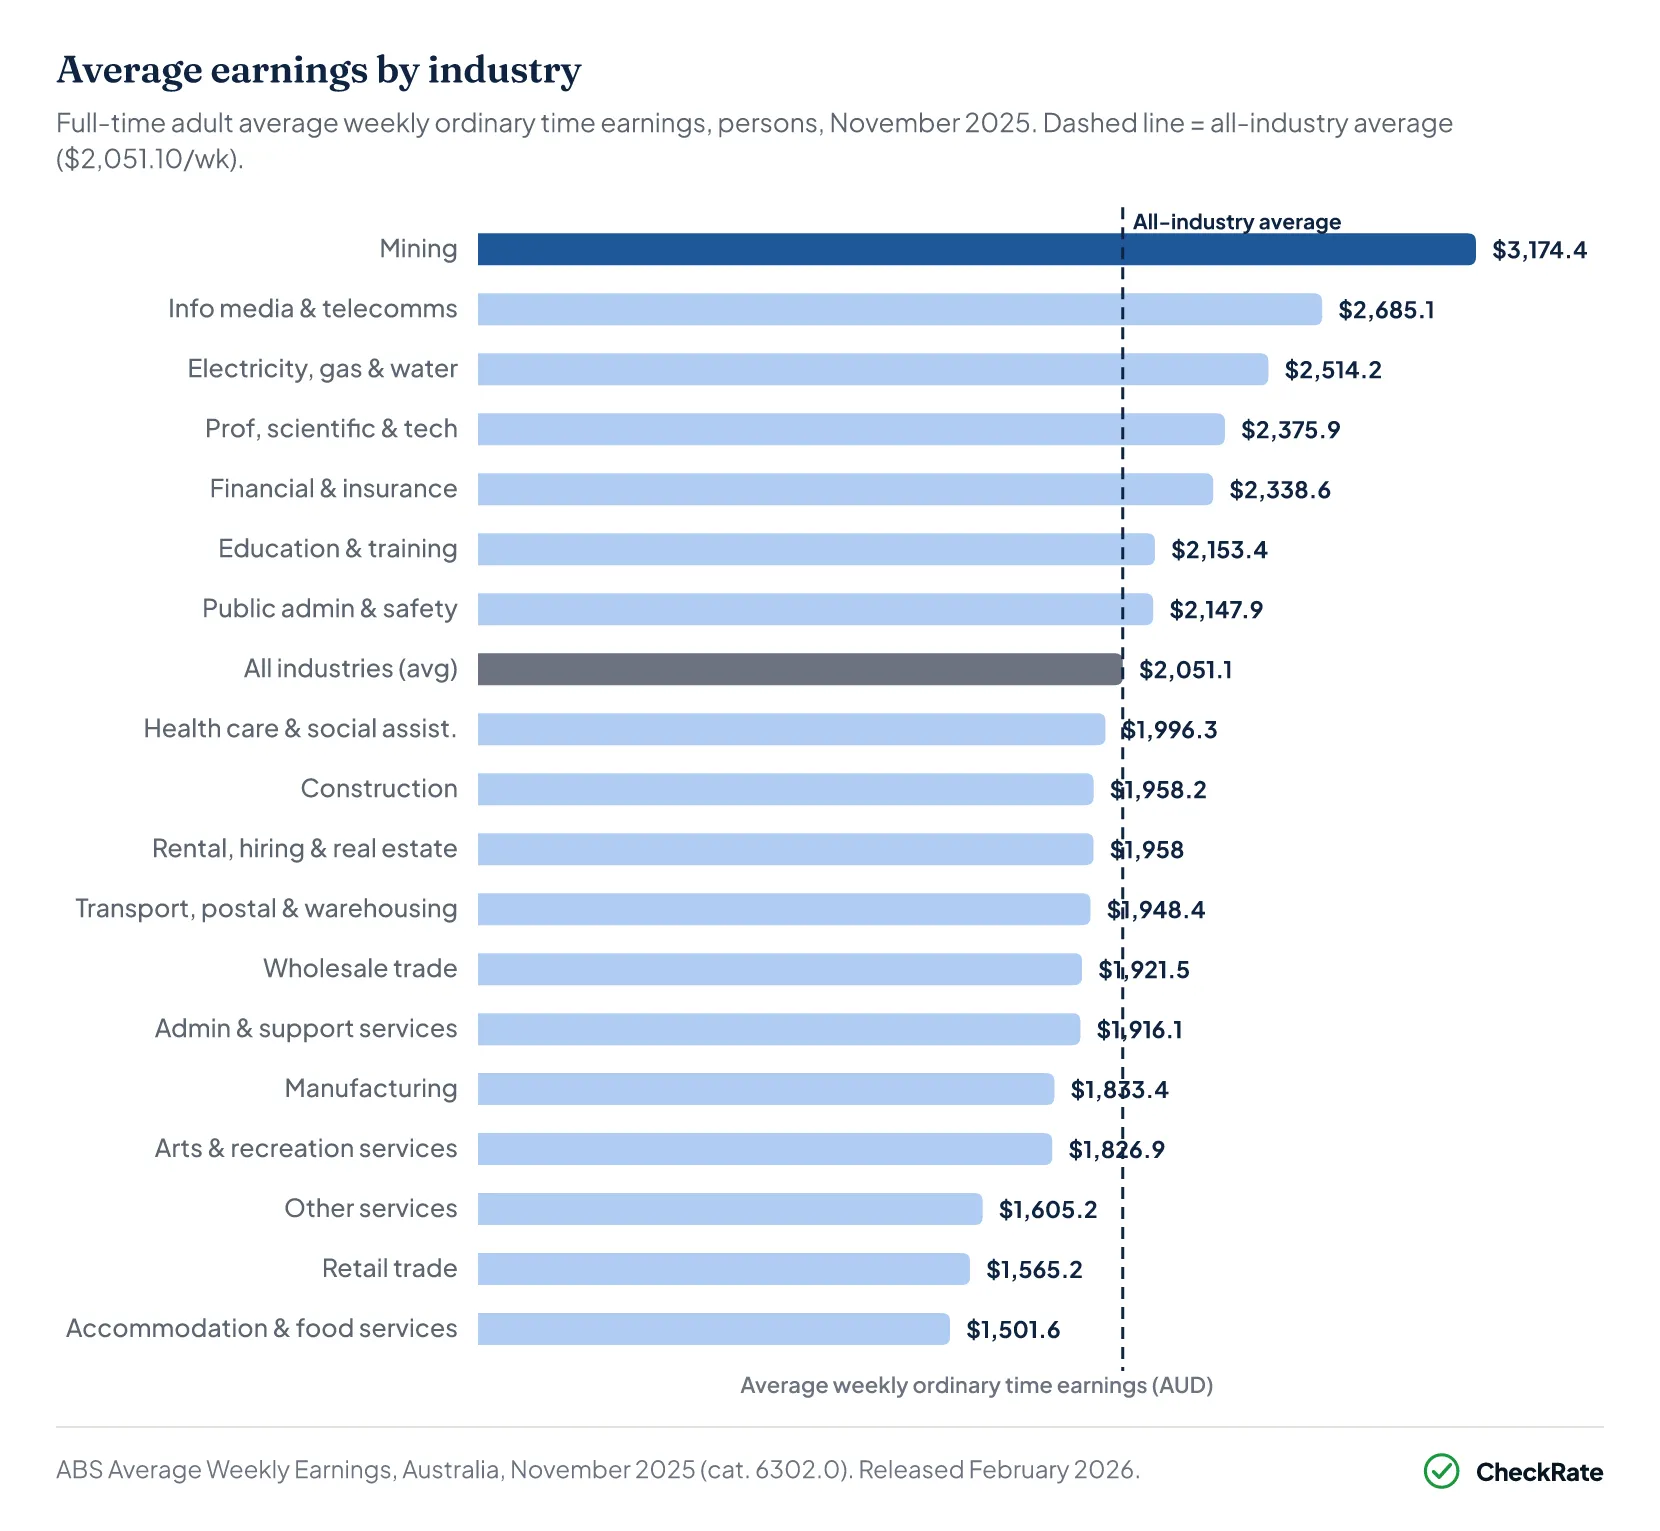
Industry can shape earnings as much as occupation. Mining workers averaged $3,174.40 a week in ordinary time earnings in November 2025, or $165,069 a year, more than double the accommodation and food services industry average of $1,501.60 a week ($78,083/yr). The gap between the highest and lowest-paying industries was about $87,000 a year.
The public sector averaged $2,215.90 a week on a full-time adult ordinary time basis in November 2025, compared with $2,006.00 a week in the private sector. That $209.90 weekly premium equates to about $10,915 a year.
One limit applies to the industry comparison: the Average Weekly Earnings survey excludes businesses engaged primarily in agriculture, forestry and fishing, so those industries do not appear in the ranking below.
Section 05 · Full-time vs part-time
How much more do full-time workers earn than part-time workers?
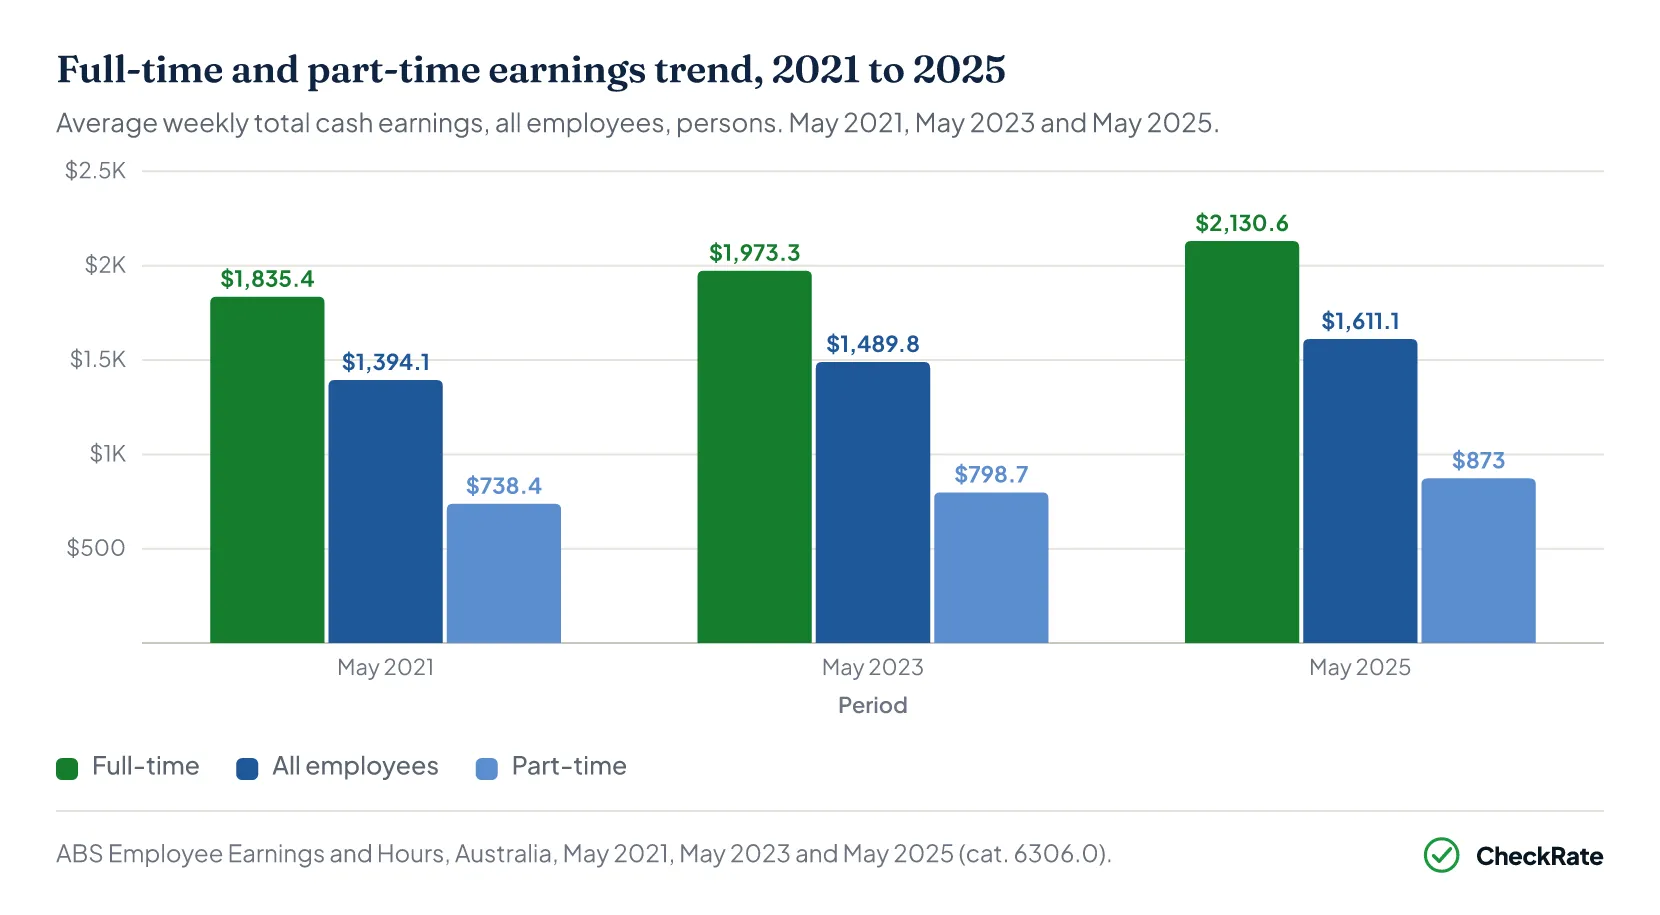
Employment type is associated with large differences in weekly earnings. In May 2025, full-time employees averaged $2,130.60 a week, while part-time employees averaged $873.00 a week. On this measure, full-time weekly earnings were 2.44 times part-time weekly earnings.
That ratio has narrowed slightly since June 2021. In May 2021, full-time earnings were 2.49 times part-time earnings. By May 2025, the ratio was 2.44 times.
Around 2.4 million employees were classified as casual in August 2025, accounting for 19% of all employees. Casual workers are more likely to work part-time, so their weekly earnings often reflect shorter hours as well as hourly rates.
Section 06 · Wage growth by occupation
Which occupations have seen the fastest wage growth?
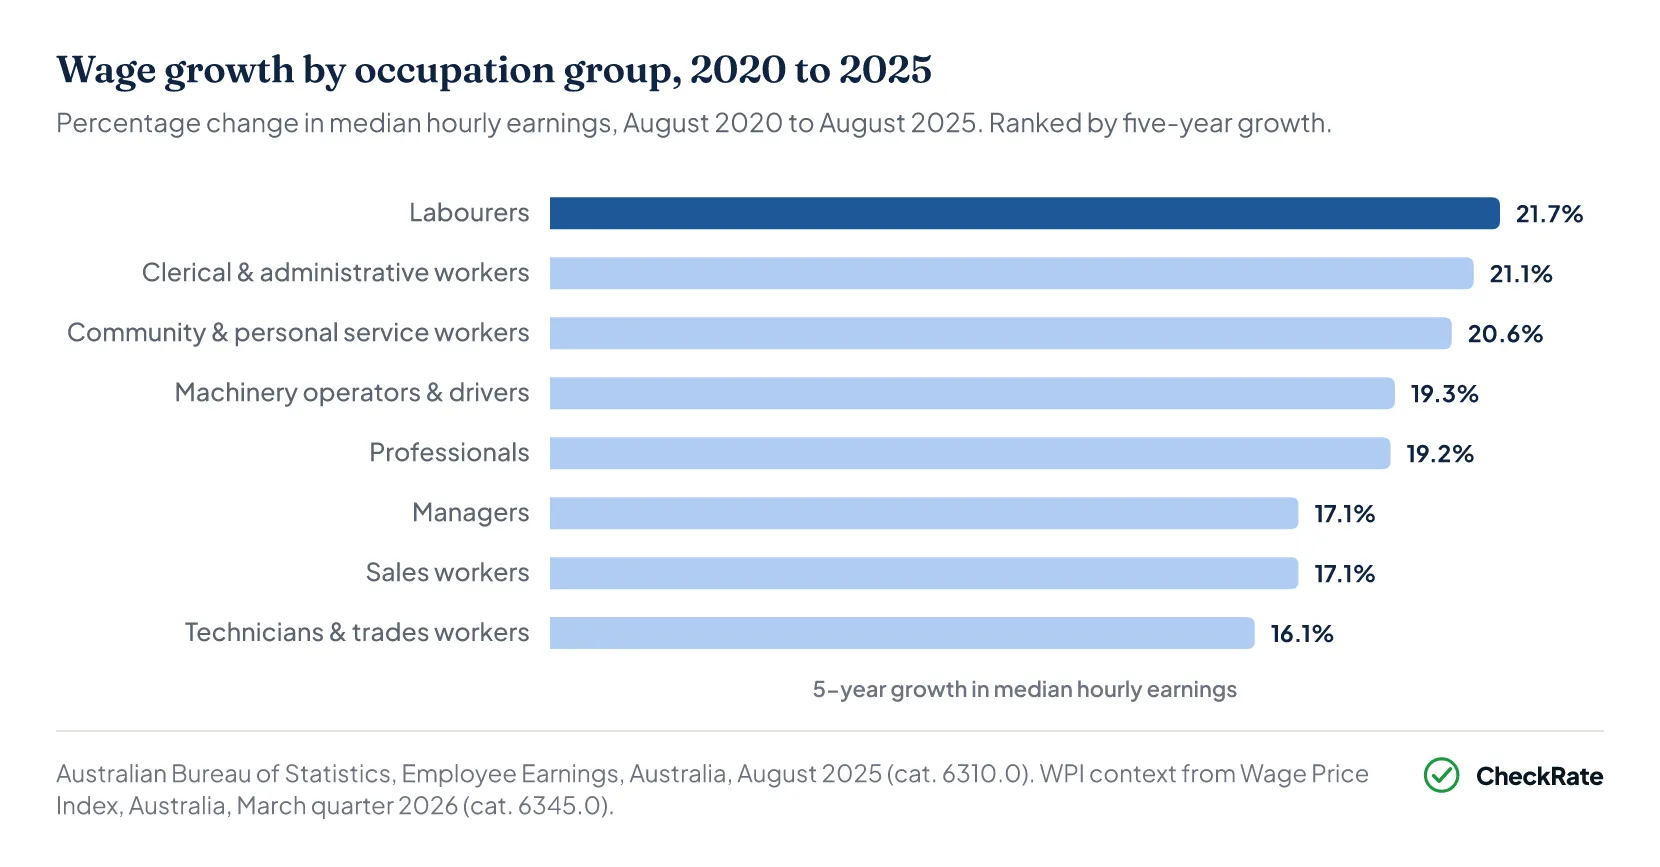
Labourers recorded the fastest growth in median hourly earnings of any major occupation group between August 2020 and August 2025, rising 21.7% over the five years, from $26.30 to $32.00 an hour. Clerical and administrative workers rose 21.1%, and community and personal service workers rose 20.6%.
At the sub-major level, arts and media professionals recorded the highest average annual growth in median weekly earnings between 2020 and 2025, at 7.9% per annum. This was the strongest published growth rate for any detailed occupation group over that period.
The overall pace of wage growth was 3.3% in the year to March 2026, as measured by the Wage Price Index. This was the slowest annual rate since 2022 and below the recent peak of 4.3% in late 2023. The three fastest-growing major groups, labourers, clerical and administrative workers, and community and personal service workers, still sit below the all-occupation average weekly earnings of $1,611.10.
Total wages and salaries paid by employers reached $110,560 million in March 2026, up 6.0% from the same month a year earlier, according to the Monthly Employee Earnings Indicator. This figure is higher than the 3.3% WPI reading because it captures both wage changes and changes in the size and composition of the workforce. The WPI measures wage movements for a fixed set of jobs only.
Section 07 · Gender pay gap by occupation
How does the gender pay gap differ by occupation in Australia?
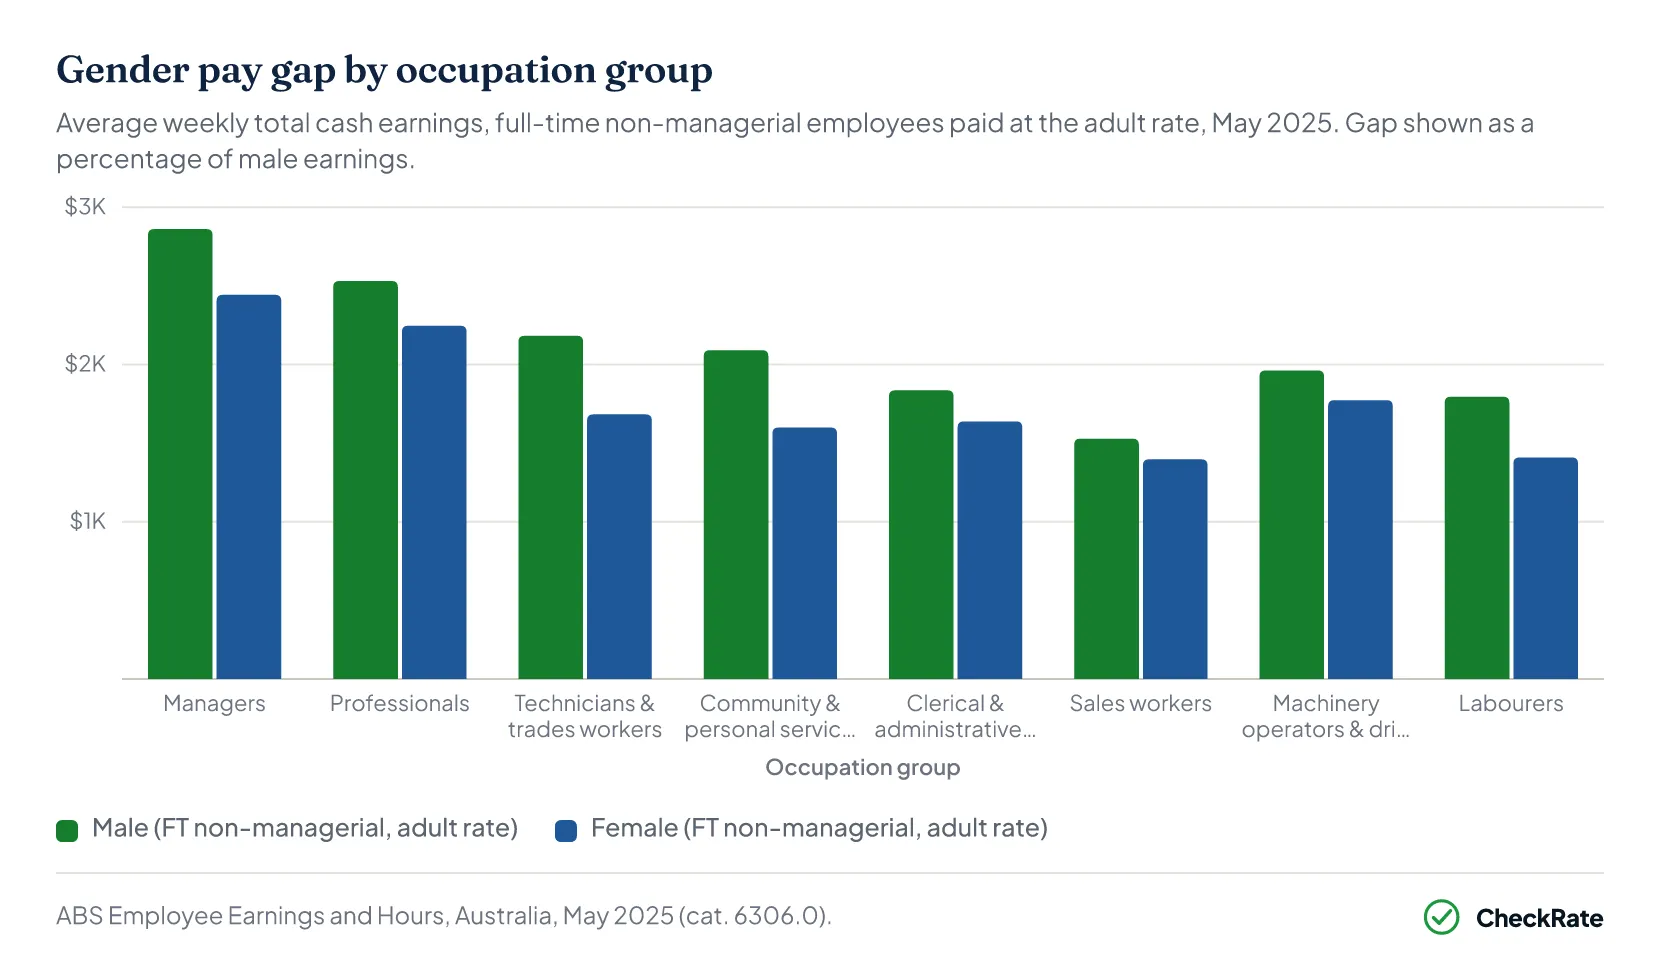
Across all occupations, full-time non-managerial employees paid at the adult rate earned $2,185.50 a week for men and $1,888.70 a week for women in May 2025. That is a gap of $296.80 a week, or roughly $15,434 a year. On a male-earnings basis, the overall gap is 13.6%.
The gap varies by occupation group. Community and personal service workers had the widest gap at 23.5%, followed by technicians and trades workers at 22.9% and labourers at 21.5%. The narrowest gaps were in sales workers (8.6%), machinery operators and drivers (9.6%), and clerical and administrative workers (10.8%).
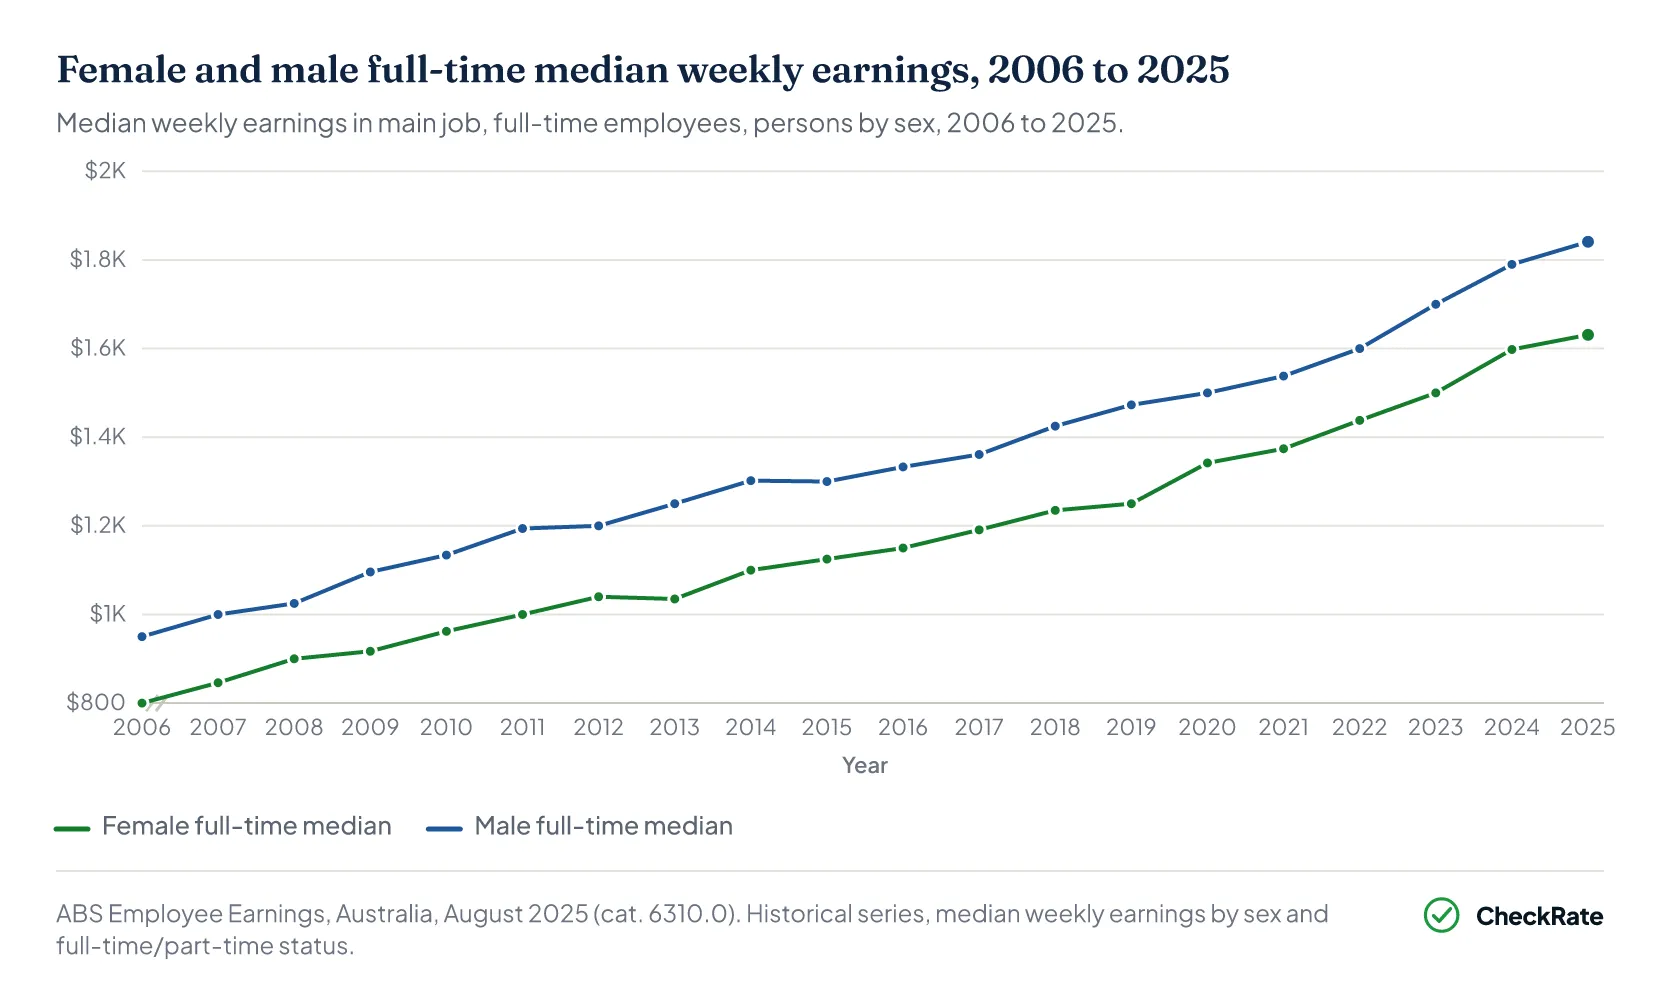
The historical picture shows some narrowing. Female full-time median weekly earnings rose from $800 a week in 2006 to $1,631 in 2025, a 103.9% increase. Male full-time median weekly earnings rose from $950 to $1,841, a 93.8% increase. As a result, female earnings as a share of male earnings improved from 84.2% in 2006 to 88.6% in 2025.
Why is the gender pay gap widest in community and personal service work?
Community and personal service workers include a mix of occupations with different earnings profiles. These can include lower-paid care roles, such as aged care and childcare workers, and higher-paid roles in protective services. The wide gap in this group may partly reflect the mix of jobs within the category, rather than showing that workers in identical roles are paid differently.
Does the overall AWE gender gap differ from the EEH figure?
Yes. On the full-time adult ordinary time earnings measure used in Average Weekly Earnings, the weekly gap in November 2025 was $247.20, with men at $2,147.80 and women at $1,900.60. The EEH figure used in this section is higher, at $296.80 a week, or 13.6%, because it uses a narrower comparison group: full-time non-managerial employees paid at the adult rate. This excludes managers and employees not paid at the adult rate. The two measures capture different parts of the workforce and should not be treated as interchangeable.
Is the gender pay gap closing?
On a percentage basis, the gap has narrowed. Female full-time median earnings were 84.2% of male earnings in 2006 and 88.6% in 2025. In dollar terms, however, the weekly gap widened from $150 a week in 2006, or $7,800 a year, to $210 a week in 2025, or $10,920 a year. This is because both male and female median earnings rose over the period, but male earnings started from a higher base.
References
- ABS Average Weekly Earnings, Australia, November 2025 · Australian Bureau of Statistics
- ABS Employee Earnings and Hours, Australia, May 2025 · Australian Bureau of Statistics
- ABS Employee Earnings, August 2025 (Cat. No. 6333.0) · Australian Bureau of Statistics
- ABS Wage Price Index, Australia · Australian Bureau of Statistics
- ABS Monthly Employee Earnings Indicator, March 2026 · Australian Bureau of Statistics