


Updated
- Average interest-bearing balance per active account
- $2,217
- calculated as balances accruing interest ÷ active accounts
- Total credit and charge card balances
- $44.2B
- across 12.2 million accounts
- Balances accruing interest
- $21.7B
- down 41% from the $36.6B peak in 2012
- Cards on issue
- 16.6M
- down 32% from the 24.3M peak in 2016
 How much debt do Australian households have?As of December 2025, Australian households owe a combined $3.40 trillion, up from $2.06 trillion ten years earlier. That means household debt has grown by 65% in a decade, adding around $1.34 trillion…
 Average mortgage repayment in Australia: what homeowners pay each monthThe repayment for a new owner-occupier loan in Australia is around $4,006 a month, or $924 a week, based on a 30-year principal-and-interest term. The estimate uses the average 2025 loan size of $693,…
 How much do Australians spend on bills each month?The average Australian household spent $674 a month on essential bills in 2025, covering electricity and gas, water, phone and internet, and home and contents insurance. That was 51% higher than in 20…
Section 01 · What Australians owe in aggregate
Total credit and charge card balances in Australia
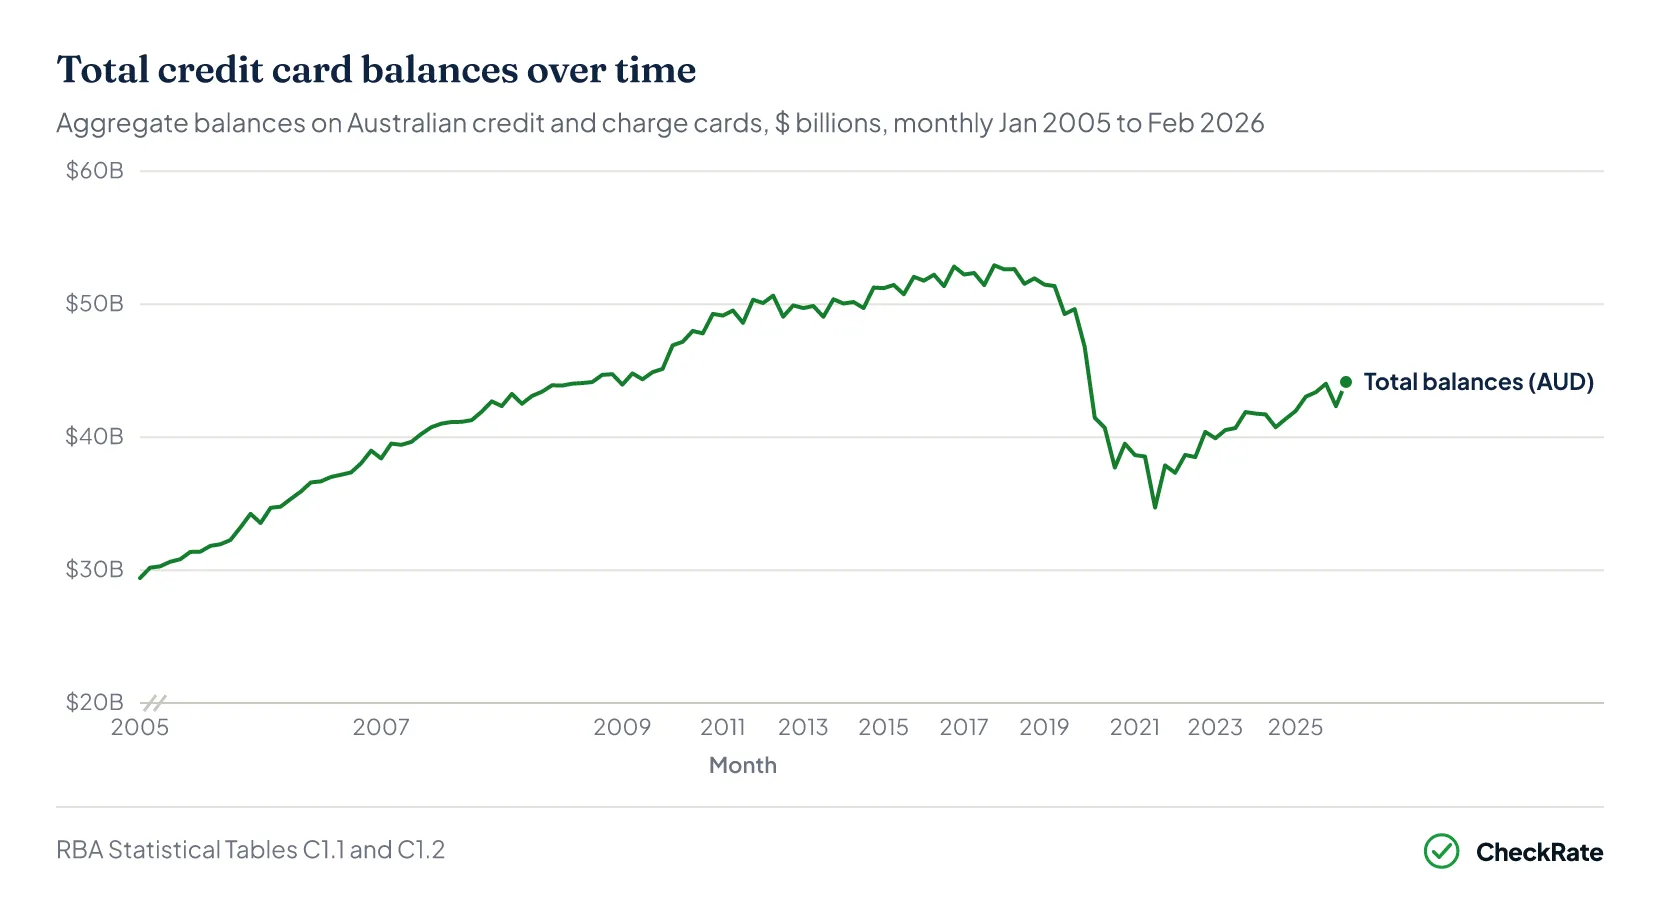
Australians had $44.2 billion owing on credit and charge card accounts in February 2026, spread across 12.2 million accounts. That puts the country 16.6% below the all-time peak of $52.9 billion in November 2017, but still 27% above the COVID-era low of $34.7 billion hit in September 2021.
The total covers everything currently sitting on credit and charge card accounts: recent purchases that haven't yet been paid off, plus revolving debt being carried month to month.
After peaking in late 2017, balances drifted down through 2018 and 2019. They fell sharply during the COVID period, with total balances declining by roughly $18 billion in under four years. The recovery since has brought balances back to around 2008 levels in dollar terms, but after inflation, the real figure remains below where it was a decade ago.
Section 02 · Average debt per active account
How average credit card debt is calculated
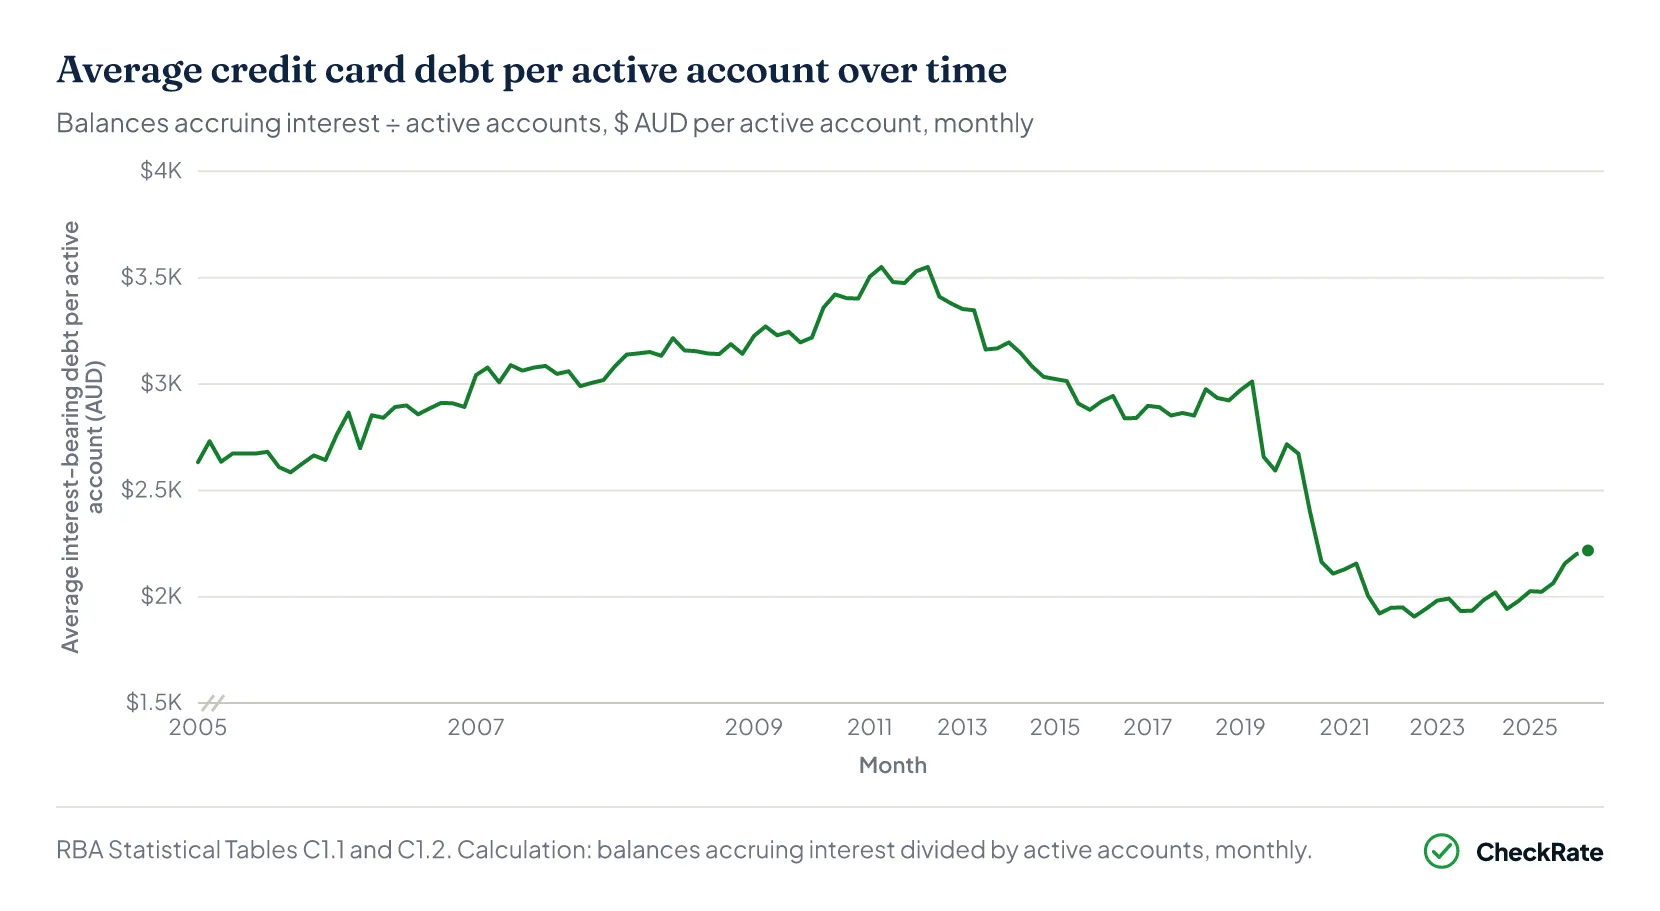
The average active credit card account carries $2,217 in interest-bearing debt as of February 2026, down roughly 38% from the 2012 peak of $3,550. The headline number depends heavily on how you do the maths, though. Different combinations of numerator and denominator give very different answers, ranging from about $2,200 to around $4,500 per account or card measure. The clearest account-based measure strips out dormant accounts and recent purchases not yet accruing interest.
Average credit card debt · Feb 2026
$2,217
Per active account
The average active credit card account carried $2,217 in interest-bearing debt. The figure is calculated as balances accruing interest ($21.74 billion) divided by active accounts (9.81 million), so it excludes dormant accounts and recent purchases sitting inside the interest-free period. The peak under this measure was $3,550 in mid-2012, meaning the average interest-bearing debt per active account is now about 38% lower than it was then.
Average credit card debt by year
Looking year by year, average interest-bearing debt per active account peaked at $3,475 in December 2011 and bottomed at $1,921 in December 2021, a peak-to-trough fall of 44.7%. The biggest single-year drop came in 2020, when the figure fell 18.7% over 12 months. After stabilising in the $1,920 to $1,980 range from 2021 to 2024, the average rose to $2,156 by December 2025 and $2,217 by February 2026.
| Average credit card debt by year · 2005 to 2026 | |||
|---|---|---|---|
| Calendar year | Avg debt per active account | YoY change | Avg total ÷ accounts |
| 2005 | $2,643 | n/a | $2,745 |
| 2006 | $2,892 | +9.4% | $2,949 |
| 2007 | $3,018 | +4.4% | $3,068 |
| 2008 | $3,142 | +4.1% | $3,146 |
| 2009 | $3,219 | +2.4% | $3,251 |
| 2010 | $3,402 | +5.7% | $3,328 |
| 2011 · peak | $3,475 | +2.1% | $3,356 |
| 2012 | $3,379 | −2.8% | $3,283 |
| 2013 | $3,167 | −6.3% | $3,242 |
| 2014 | $3,034 | −4.2% | $3,255 |
| 2015 | $2,879 | −5.1% | $3,172 |
| 2016 | $2,840 | −1.3% | $3,166 |
| 2017 | $2,864 | +0.8% | $3,170 |
| 2018 | $2,923 | +2.1% | $3,269 |
| 2019 | $2,593 | −11.3% | $3,392 |
| 2020 | $2,109 | −18.7% | $2,901 |
| 2021 · low | $1,921 | −8.9% | $2,877 |
| 2022 | $1,943 | +1.1% | $3,047 |
| 2023 | $1,934 | −0.4% | $3,102 |
| 2024 | $1,980 | +2.4% | $3,424 |
| 2025 | $2,156 | +8.9% | $3,582 |
| 2026 · Feb · latest | $2,217 | +2.8% | $3,618 |
Source · RBA Statistical Tables C1.1 and C1.2
Section 03 · Credit card balances by category
The three types of credit card debt in Australia
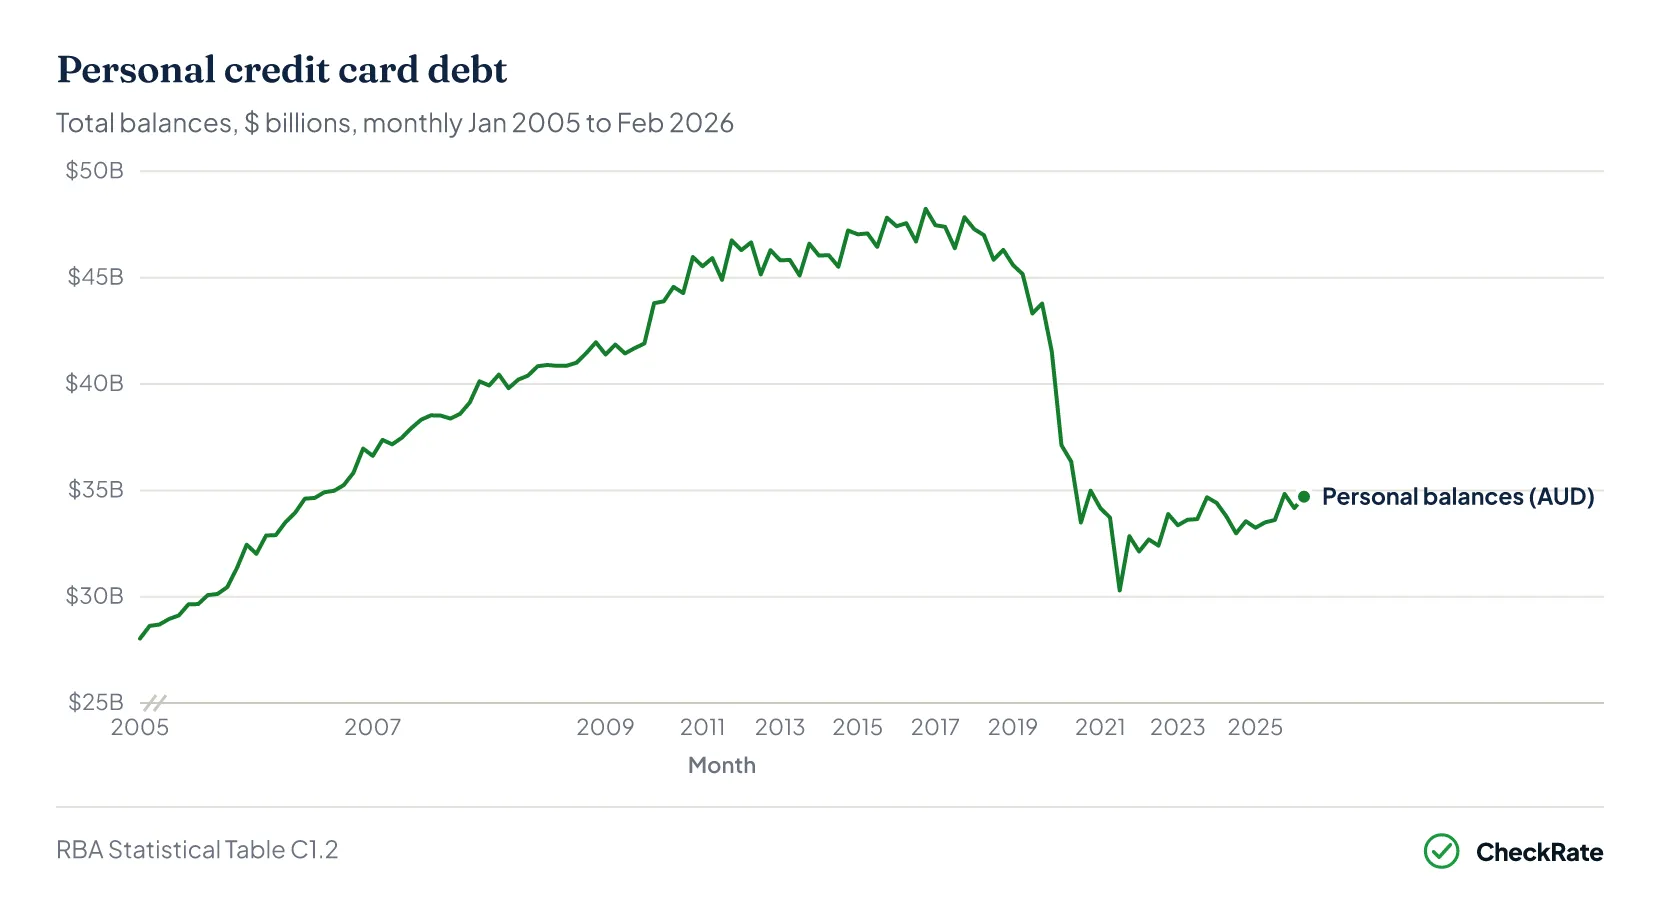
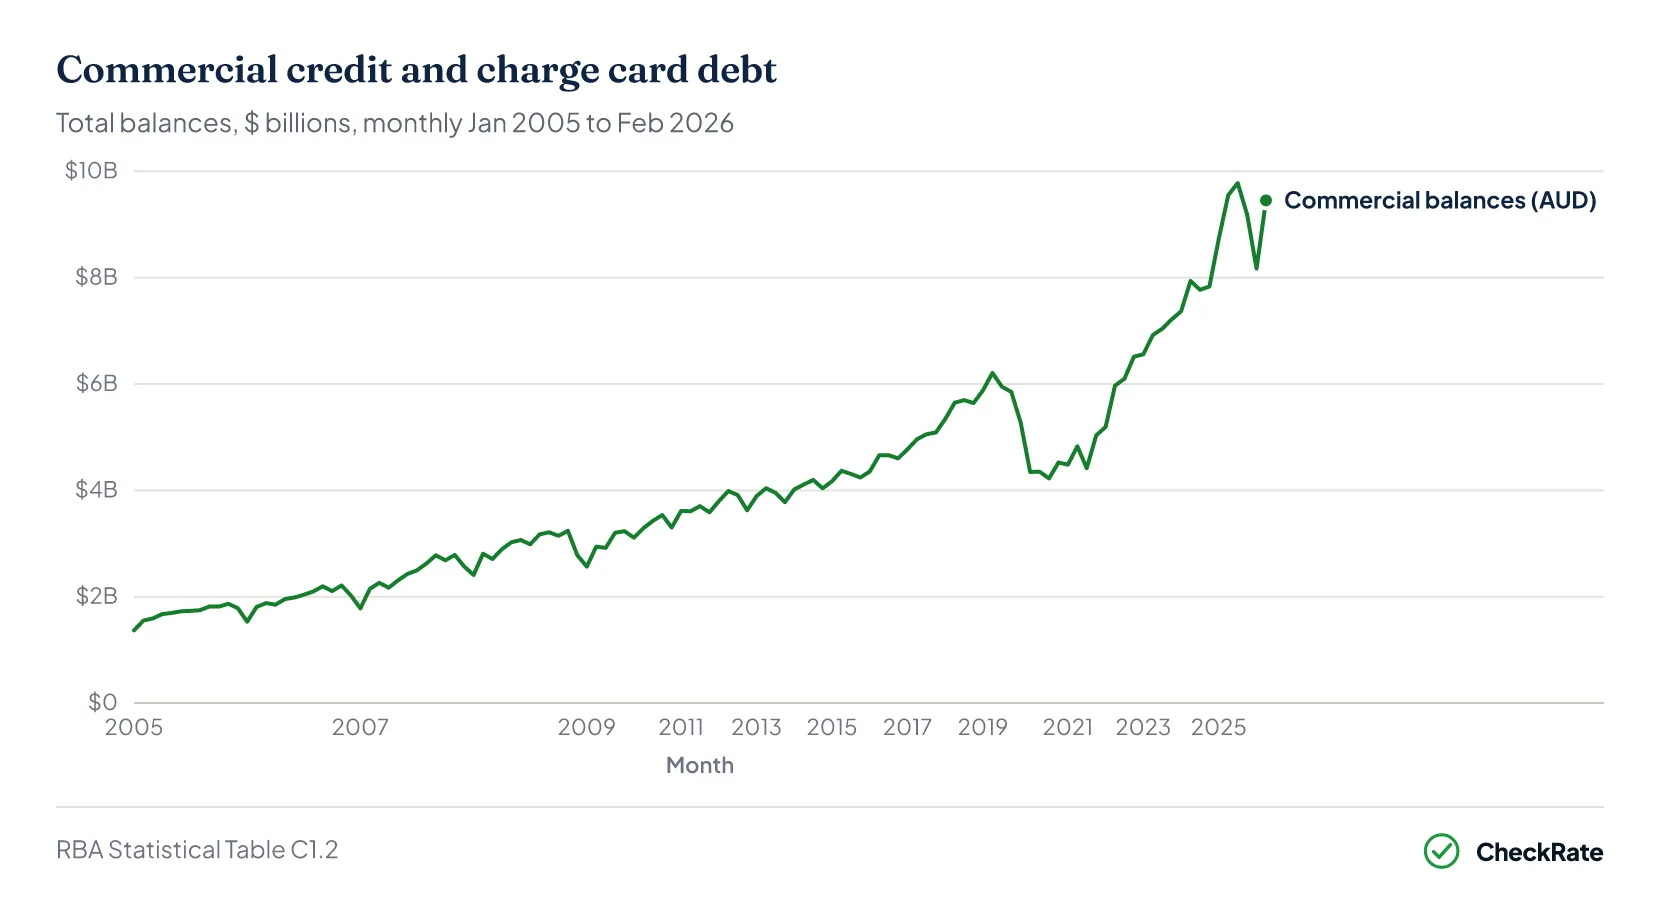
Of the $44.2 billion owing on credit and charge card accounts in February 2026, personal accounts made up roughly 79%, or $34.7 billion. Commercial accounts accounted for the remaining 21%, or $9.5 billion. The RBA also tracks cash advances separately as a transaction measure, rather than a balance category.
Personal credit and charge card debt
Personal accounts held $34.7 billion in total balances, with $19.6 billion of that accruing interest in February 2026. Personal cards accounted for around 79% of total credit and charge card balances and almost 90% of balances accruing interest.
Personal accounts have accounted for most of the long-run decline in Australian credit and charge card balances. The number of personal accounts fell from a peak of around 15.5 million in mid-2017 to 11.5 million in February 2026, a drop of approximately 26%. Personal balances and the interest-bearing portion have also fallen over the period.
Commercial credit and charge card debt
Commercial accounts had $9.5 billion in balances on commercial cards, with $2.1 billion of that accruing interest in February 2026. Commercial cards made up roughly 21% of total balances but only 10% of balances accruing interest, showing that a smaller share of commercial card balances was interest-bearing than personal card balances.
Commercial balances have been broadly steady since 2018, moving between $7 billion and $10 billion. The number of commercial accounts has stayed within a range of about 700,000 to 1.2 million across the series. The long-run decline in total card balances has been concentrated more heavily in personal accounts than commercial accounts.
Cash advances
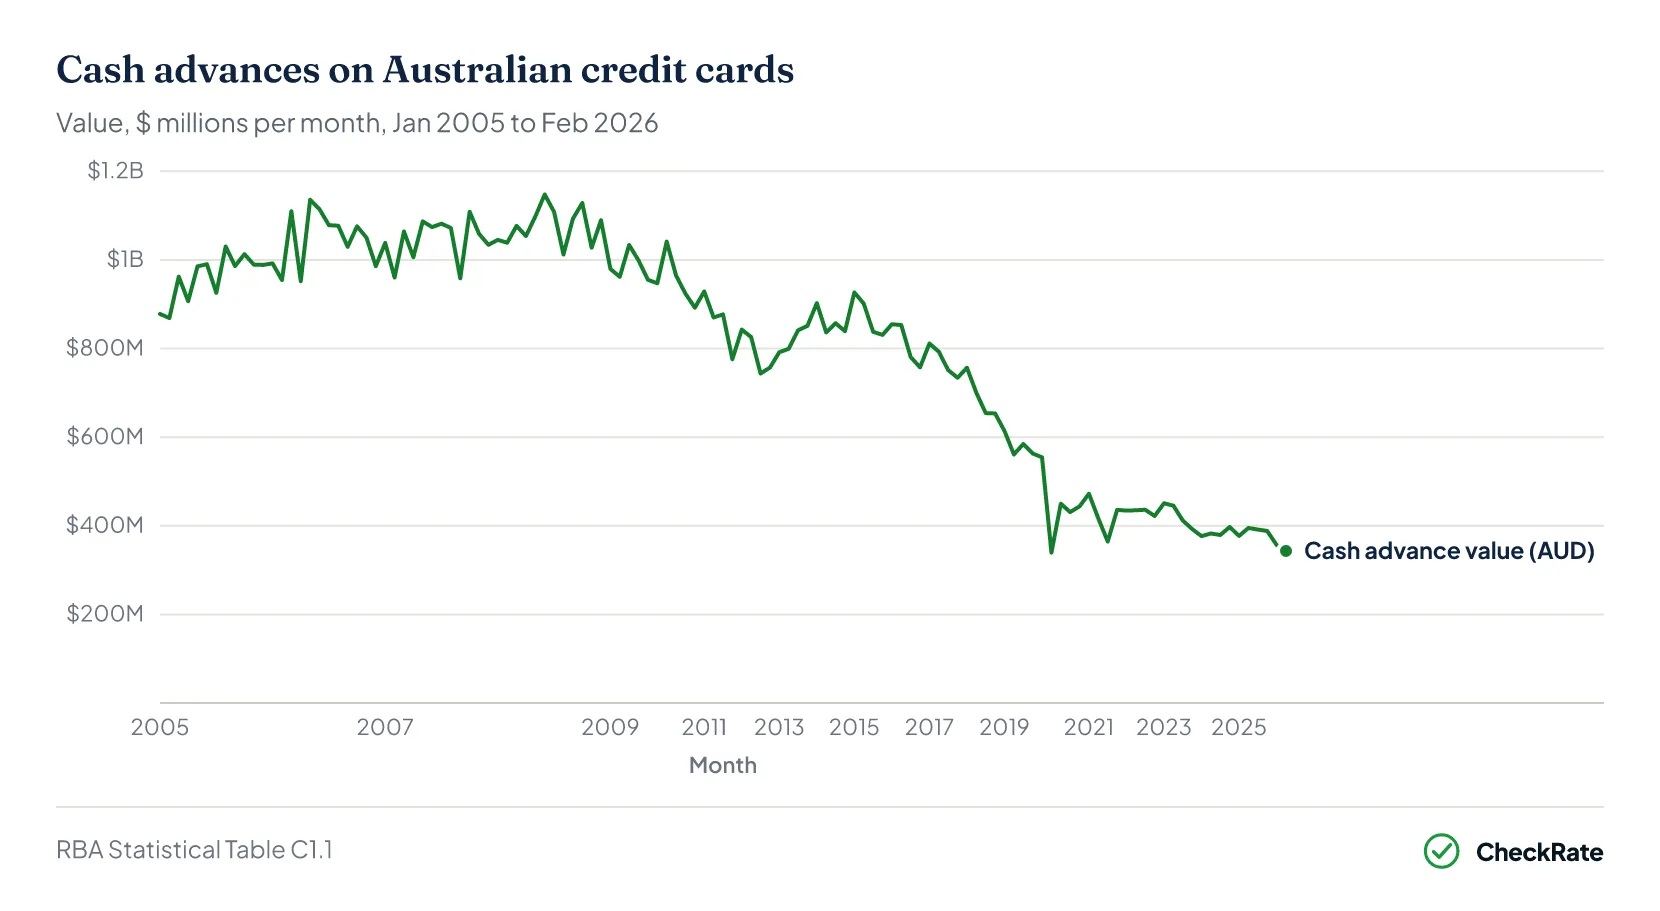
Australians took out $343 million in cash advances across 801,000 transactions in February 2026. Both figures are down roughly 70% from their late-2008 peaks. A cash advance is money withdrawn from a credit card account as cash, usually through an ATM or over the counter at a bank.
Monthly cash advances peaked at $1.09 billion in late 2008, when Australians made 2.85 million such transactions in a single month. The decline since then occurred alongside the rise of debit cards, greater use of everyday transaction accounts, and the broader move away from cash for daily spending.
| The three types of credit card debt, side by side | ||
|---|---|---|
| Type | What it measures | Value |
| Personal balances | Stock: owed on personal credit cards | $34.7B |
| Commercial balances | Stock: owed on business credit and charge cards | $9.5B |
| Cash advances | Flow: value of cash withdrawals in the latest month | $343M |
Source · RBA Statistical Tables C1.1 and C1.2 (Feb 2026)
Credit card debt by type, year by year
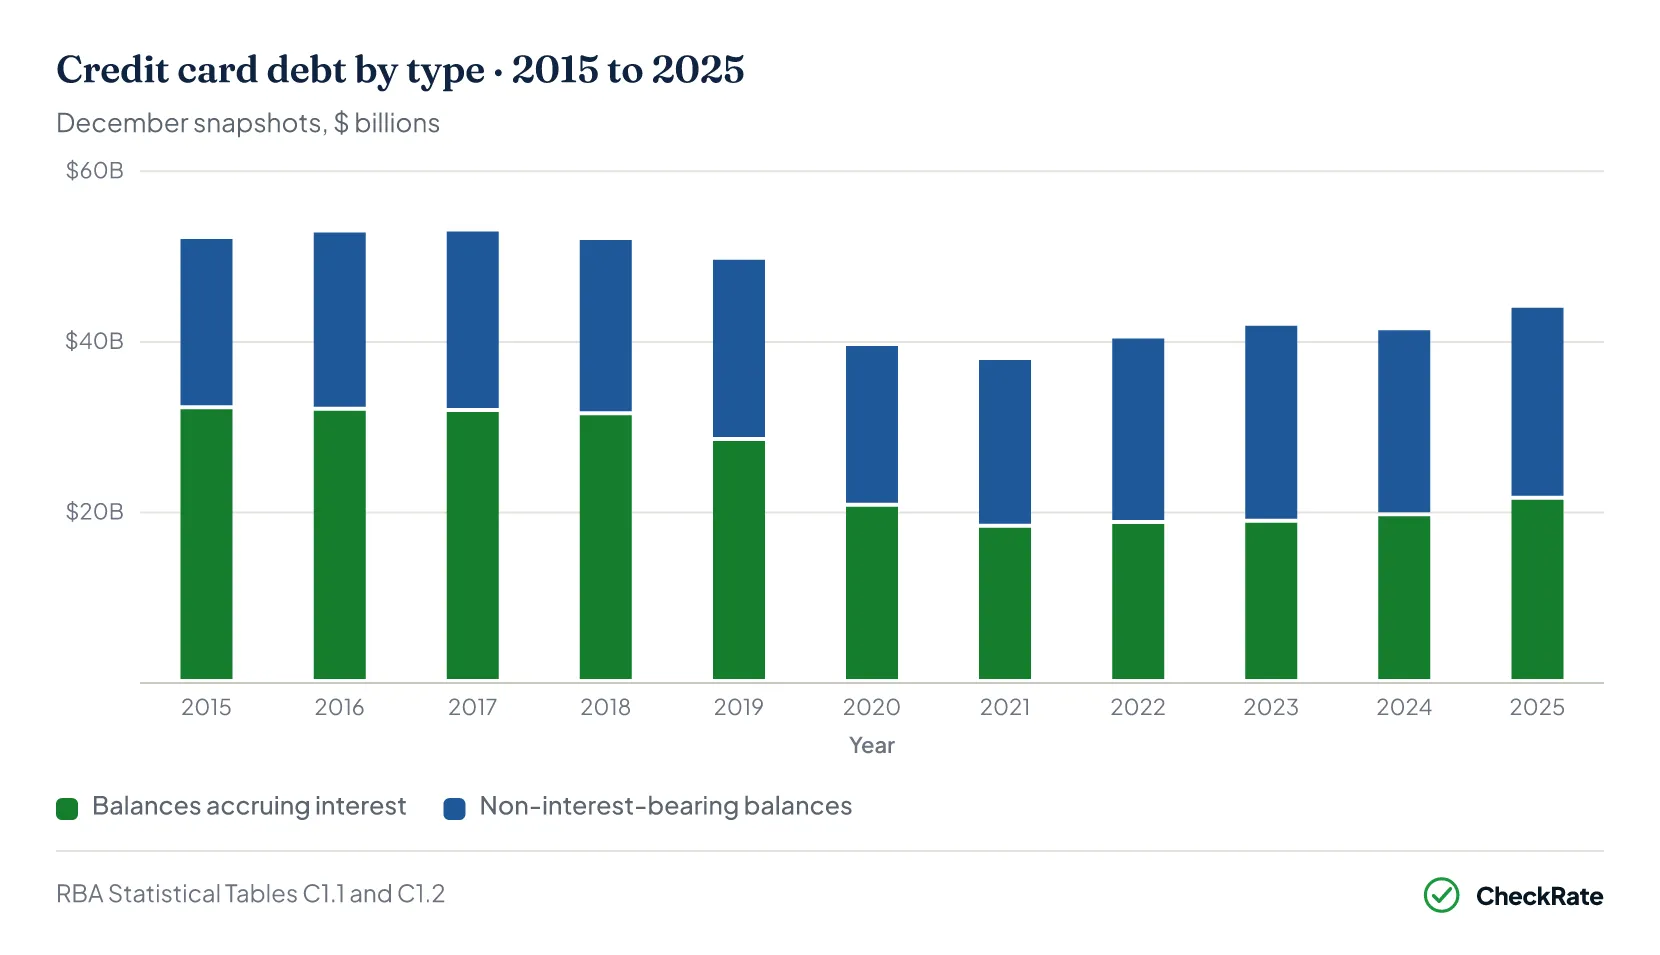
A yearly view shows that 2021 was the first year in which non-interest-bearing balances were higher than interest-bearing balances. They have remained higher in each year since. Total balances peaked in 2017 at $52.9 billion before declining, while commercial balances more than doubled from $4.2 billion in 2015 to $9.2 billion in 2025, even as personal balances fell.
Section 04 · The size of the card system
Credit card statistics in Australia
Beyond balances, the number of credit and charge card accounts has also fallen over the past decade. The four headline figures below describe the overall size and structure of the card system in Australia.
Three relationships between these numbers stand out:
- About 20% of credit and charge card accounts on issue were not active in the most recent quarter.
- The ratio of cards to accounts was roughly 1.4, reflecting supplementary cards issued on some accounts.
- Credit-limit utilisation, measured as total balances divided by total credit limits, was about 35%. Interest-bearing balances were equal to about 17% of total credit limits.
Source · RBA Credit and Charge Cards, C1.2 · from www.rba.gov.au
Section 05 · Payment activity
Credit card repayments and purchases in Australia
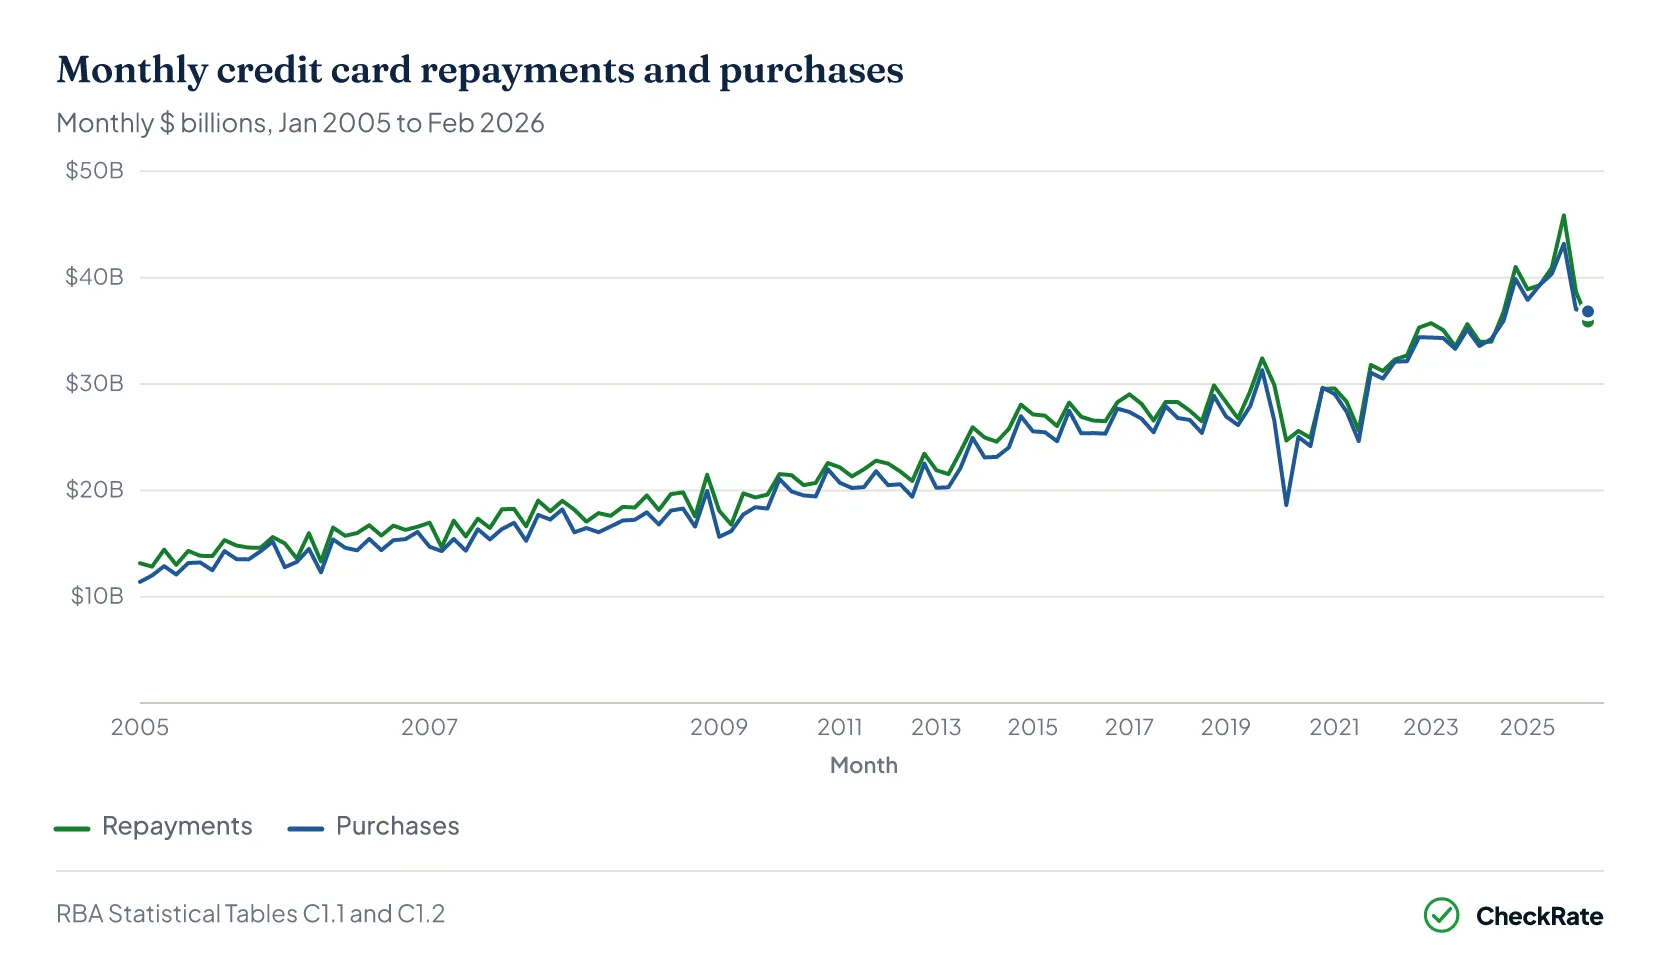
Repayments to credit card accounts came to $35.9 billion in February 2026, against $36.8 billion in purchases over the same month. That puts the repayments-to-purchases ratio at roughly 97%. December 2025 set the all-time monthly repayment record at $45.9 billion, reflecting the seasonal clearing of Christmas spending.
A repayments-to-purchases ratio close to 100% shows that, in aggregate, Australians are paying off about as much as they spend on credit and charge cards each month. It does not show whether individual cardholders paid off their full balance each cycle. At the system level, the data shows repayments were close to purchases in February 2026. This is consistent with credit cards being used more as a payment product than a revolving debt product.
Total credit card balances in Australia
Repayments and purchases are flow figures, meaning they measure money moving in or out during a month. Total balances are stock figures, meaning they measure the amount owing at a point in time. Over time, the gap between repayments and purchases helps explain whether total balances rise or fall.
In each full calendar year over the past decade, total repayments exceeded total purchases by between $0.4 billion and $2.7 billion. That is consistent with the decline in total balances between 2017 and 2022. Since 2022, total balances have stabilised and then risen modestly. The data does not isolate a single cause, but the shift coincided with fewer accounts leaving the system and higher average balances among remaining accounts.
Credit card spending and purchase trends
Beyond the headline totals, three spending patterns stand out in the data:
- Mobile wallet payments have grown quickly since 2018. In February 2026, they made up $6.8 billion of $36.8 billion in total purchases, or about 18%, up from near zero a decade earlier.
- Overseas purchases have rebounded since COVID, reaching $2.1 billion in February 2026. That was the second-largest monthly figure on record, behind late 2025.
- Cash advances have continued to decline. They now account for less than 1% of total credit card transaction value, down from roughly 5% in the late 2000s.
Together, these trends show a shift in card activity. Credit and charge cards are being used more digitally, while cash advances have become a much smaller part of transaction value.
Key moments in two decades of credit card data
Five dates stand out across the full series. Together, they show how credit and charge card balances, account numbers and repayments have changed over time.
Jun 2012
Balances accruing interest peak at $36.6 billion
Balances accruing interest reached their highest point in June 2012. Average interest-bearing debt per active account also peaked that month at $3,550. This measure has remained below that level since.
Oct 2016
Cards on issue peaked at 24.3 million
Cards on issue reached their highest point in October 2016. By February 2026, the number of cards on issue had fallen to 16.6 million, a decline of around 32%.
Nov 2017
Total balances peaked at $52.9 billion
Total credit and charge card balances reached $52.9 billion in November 2017. By February 2026, total balances were $44.2 billion, or 16.6% below that peak.
Late 2021
COVID low and the interest-bearing crossover
Total balances fell to $34.7 billion in September 2021. By the end of 2021, non-interest-bearing balances were also higher than interest-bearing balances for the first time in the annual December snapshot, and they have remained higher in each year since.
Dec 2025
Record $45.9 billion in monthly repayments
Monthly credit card repayments reached $45.9 billion in December 2025, the highest monthly value in the RBA series. In recent years, repayments have often been close to, or above, monthly purchases.
Together, these points show a smaller card system than at its mid-2010s peak, lower balances accruing interest than in 2012, and stronger repayment activity in recent years. The data suggests credit and charge cards are being used less as a revolving debt product than they were in earlier periods.
Section 06 · Pulling the picture together
What the data shows about credit card debt in Australia
Five clear patterns emerge across the full RBA series. Together, they show how credit card balances, account numbers, repayments and cash advances have changed over the past two decades.
Total credit card debt has fallen 17% from its 2017 peak
Total balances dropped from $52.9 billion in late 2017 to a COVID-era low of $34.7 billion in September 2021, before rebuilding to $44.2 billion by early 2026. The recovery is partial rather than complete. After adjusting for inflation, total balances are still well below where they were a decade ago.
Interest-bearing credit card debt has fallen further and faster
The amount of debt being charged interest peaked at $36.6 billion in 2012 and now sits at $21.7 billion, a 41% drop in dollar terms. The share of total balances being charged interest has fallen from 72% in 2008 to about 49% today, showing a shift in how credit cards are being used.
The decline is concentrated in personal accounts
Business and corporate card balances have been broadly flat since 2018. Personal accounts, on the other hand, have fallen from a peak of 15.5 million to 11.5 million. The long retreat from credit cards in Australia has been more visible in personal accounts than in commercial accounts.
Remaining card accounts carry less interest-bearing debt
Average interest-bearing debt per active account has settled at around $2,200 since COVID, well below the 2012 peak of $3,550. Monthly repayments have closely matched monthly purchases for years. Interest-bearing balances are equal to about 17% of total credit limits.
Credit cards are rarely used for cash withdrawals
Cash advances (taking cash out from a credit card account) have fallen by about 70% since 2008 and now make up less than 1% of total credit card transaction value. Cash advances have become a much smaller part of credit card activity.
The Australian credit card has not disappeared. It has been narrowed: used by a smaller, more concentrated group of cardholders, more often as a payment tool and less often as a borrowing tool. That is the most useful summary the data offers across two decades.