

Published
Section 01 · June 2026
How many actively trading businesses were operating in Australia at 30 June 2026?
Australia had 2,814,778 actively trading businesses at 30 June 2026, according to the Australian Bureau of Statistics (ABS) Counts of Australian Businesses data1. The number grew from 2,729,648 at 30 June 2025 to 2,814,778 at 30 June 2026, an increase of 85,130 businesses, or 3.1%.
The ABS counts a business as actively trading when it has an Australian Business Number and is remitting goods and services tax at 30 June2. A business that stops remitting GST for five consecutive quarters is treated as no longer trading.
Section 02 · By size
How many Australian businesses have employees?
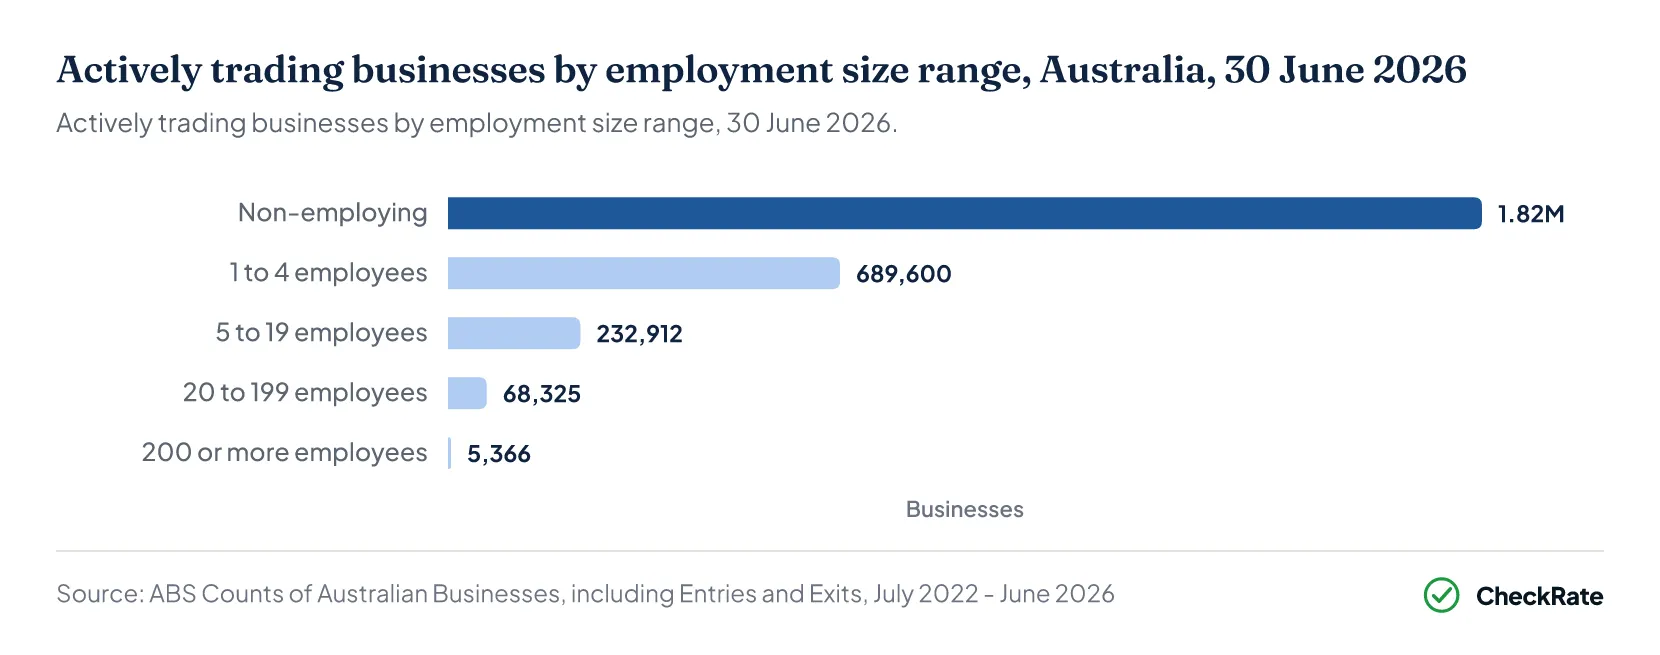
Businesses with employees totalled 996,203 at 30 June 2026, or 35.4% of all businesses in Australia. A further 1,818,575 businesses had no employees, accounting for 64.6%1. Businesses with fewer than 20 employees, including those with no employees, numbered 2,741,087, or 97.4% of all businesses. There were 73,691 businesses, or 2.6%, with 20 or more employees.
The ABS does not publish a small-business count. This page uses its employment-size bands, with fewer than 20 employees as small.
Non-employing businesses accounted for almost all of the growth in 2025-26, adding 83,105 businesses, or 4.8%. By comparison, the number of employing businesses increased by 2,025, or 0.2%1. Across the four employing size groups, growth ranged from 0.1% to 0.8% in 2025-26.
Employment size is based on employee counts from the previous financial year. The June 2026 groups therefore use employee data reported for 2024-252.
Businesses also moved between size groups in 2025-26. On a net basis, 33,781 surviving businesses moved out of the 1-to-4-employee group into other size groups, while the non-employing group gained 28,127 businesses from the employing size groups1.
Among non-employing businesses, entries exceeded exits by 54,978 in 2025-26, with the net movement of 28,127 surviving businesses into the group accounting for the rest of its 83,105 increase1. The 1-to-4-employee group recorded 96,858 entries and 62,347 exits, but a net loss of 33,781 surviving businesses moved to other size groups, leaving the group just 730 businesses higher at 30 June 2026 than at 30 June 2025.
| Businesses by employment size range, entries, exits and change, Australia, 2025-26 | ||||||
|---|---|---|---|---|---|---|
| Employment size | Businesses, 30 June 2026 | Share (%) | Entries | Exits | Change over 2025-26 | Change (%) |
| Non-employing | 1,818,575 | 64.6 | 354,098 | 299,120 | +83,105 | +4.8 |
| 1 to 4 employees | 689,600 | 24.5 | 96,858 | 62,347 | +730 | +0.1 |
| 5 to 19 employees | 232,912 | 8.3 | 8,275 | 11,739 | +783 | +0.3 |
| 20 to 199 employees | 68,325 | 2.4 | 1,178 | 2,000 | +468 | +0.7 |
| 200 or more employees | 5,366 | 0.2 | 52 | 125 | +44 | +0.8 |
| All businesses | 2,814,778 | 100.0 | 460,461 | 375,331 | +85,130 | +3.1 |
Source · ABS, Counts of Australian Businesses, including Entries and Exits, Table 13
Section 03 · Entries and exits
How many businesses start and close each year in Australia?
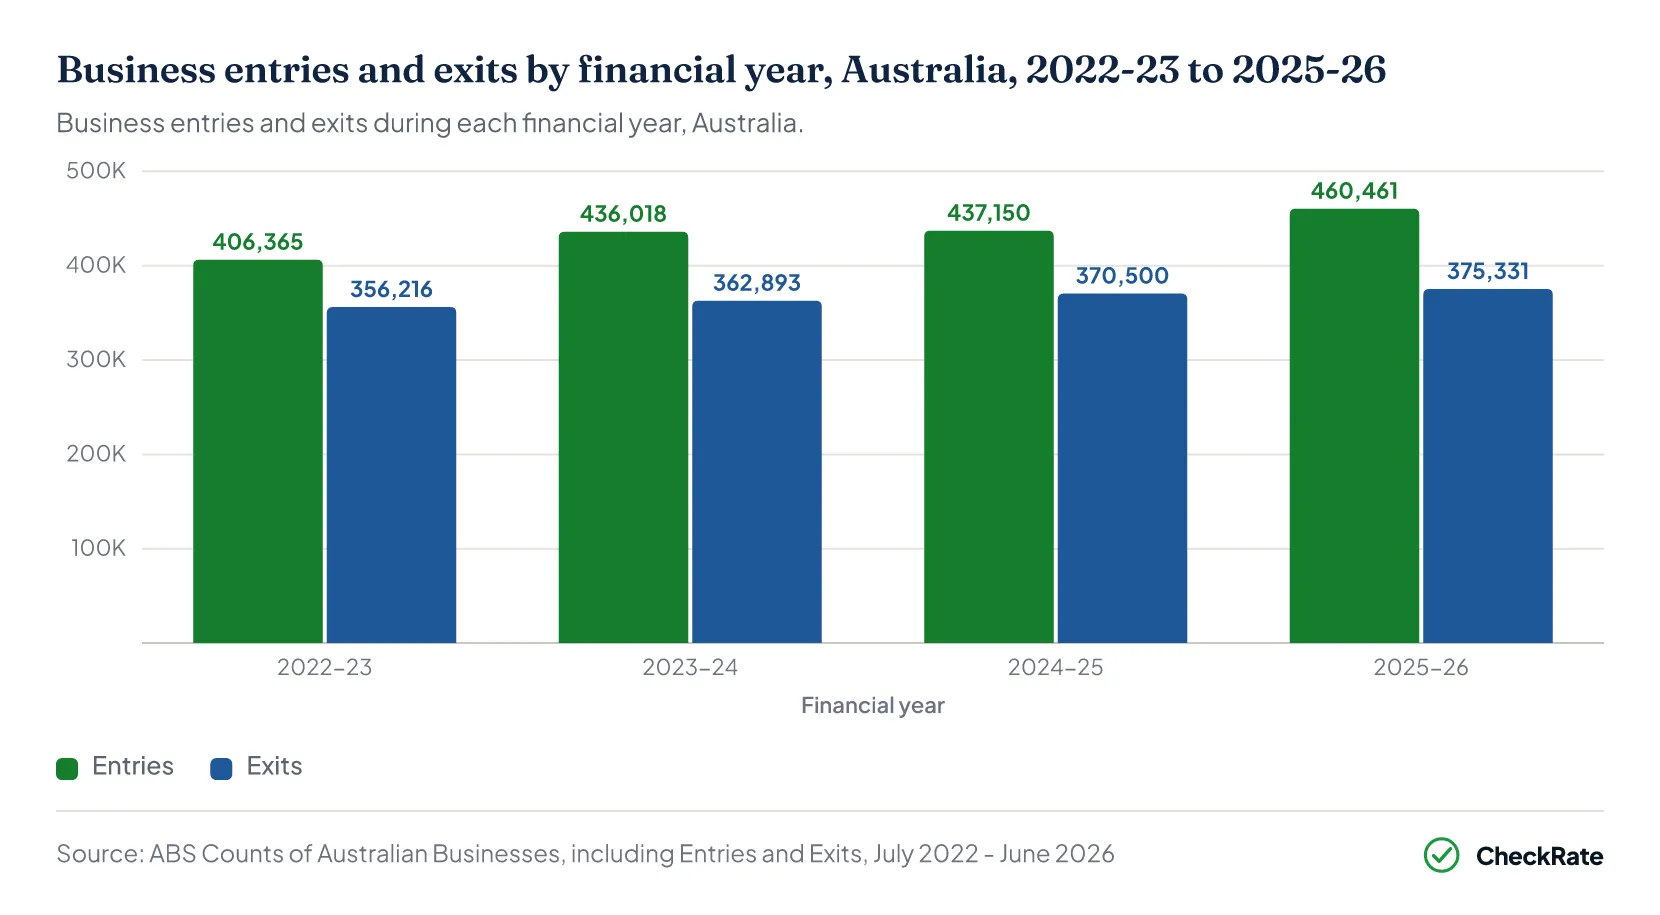
Business entries numbered 460,461 in 2025-26, equal to an entry rate of 16.9%. Exits numbered 375,331, equal to an exit rate of 13.8%1. An entry is a business that was trading at 30 June 2026 but not at 30 June 2025, and an exit is the reverse. An exit is not the same as a business failure, because exits include cancellations and businesses that stopped remitting GST or moved out of scope2.
Both rates are measured against the 2,729,648 businesses operating at 30 June 2025. An entry rate above the exit rate means the number of businesses grew over 2025-261.
Business births (new business registrations) numbered 316,178, or 68.7% of entries1. The other 144,283 entries were businesses that were reactivated or reclassified into scope. Cancellations accounted for 297,588 of the exits, or 79.3%, while the other 77,743 exits were businesses that stopped remitting GST or were reclassified out of scope.
Non-employing businesses had an entry rate of 20.4% and an exit rate of 17.2% in 2025-26, compared with 10.7% and 7.7% respectively for employing businesses1.
The Australian Securities and Investments Commission recorded 14,153 companies entering external administration for the first time in 2025-264. That count covers companies only, while the 375,331 exits cover businesses of every type.
Company external administrations are covered in the business insolvencies article.
Section 04 · Survival
What share of Australian businesses survived four years?
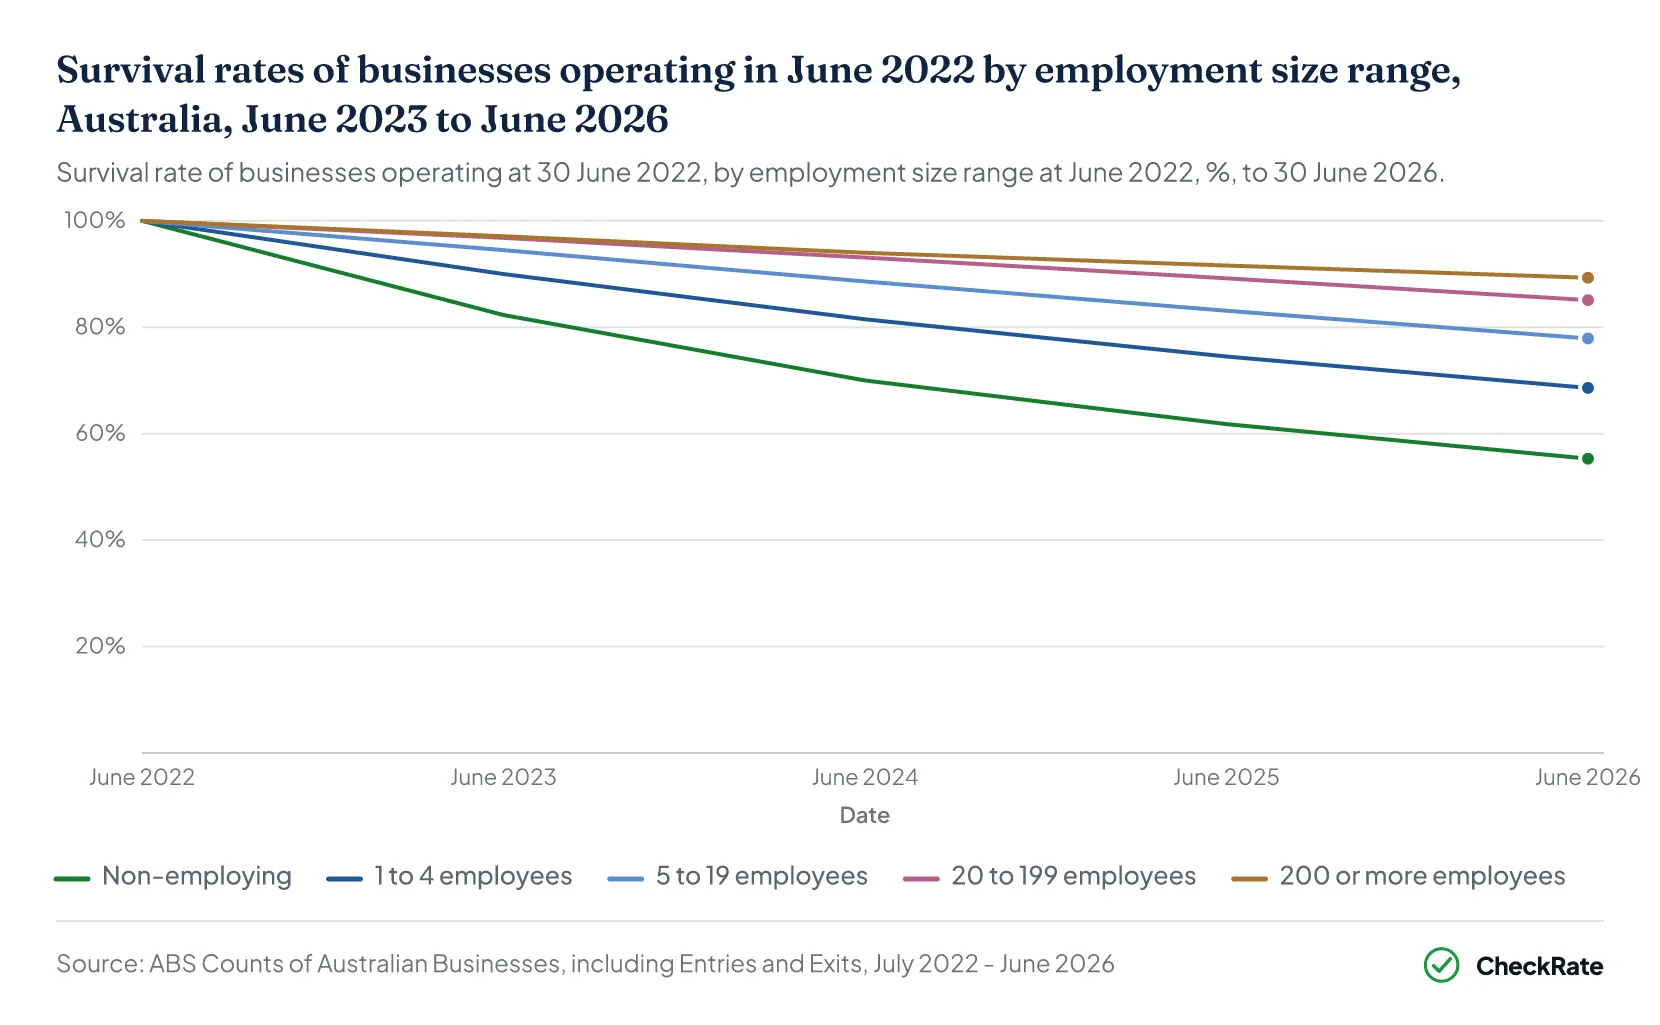
Of the 2,539,724 businesses operating at 30 June 2022, 61.9% were still actively trading at 30 June 20261. The survival rate was 86.0% after one year, 75.5% after two years and 68.1% after three years.
Businesses with 200 or more employees recorded the highest four-year survival rate among the five employment size groups, at 89.3%1. Non-employing businesses recorded the lowest four-year survival rate, at 55.3%, and the survival rate increased with each larger employment size group.
Businesses that entered in 2022-23 survived at a lower rate than those already trading in June 2022. Of the 406,365 businesses that entered in 2022-23, 49.2% were still actively trading at 30 June 2026, three years later, compared with a three-year survival rate of 68.1% for businesses already operating in June 20221.
The three-year survival rate for the new businesses was 44.6% for non-employing businesses, which made up 73.2% of the 406,365 entries, and 61.1% for businesses with 1 to 4 employees1. New businesses that had employees at entry recorded a three-year survival rate of 61.5%.
| Survival rates of businesses operating in June 2022, by employment size range, Australia, to June 2026 | |||||
|---|---|---|---|---|---|
| Employment size at June 2022 | Operating in June 2022 | Survived to June 2023 (%) | June 2024 (%) | June 2025 (%) | June 2026 (%) |
| Non-employing | 1,521,428 | 82.3 | 70.0 | 61.8 | 55.3 |
| 1 to 4 employees | 727,457 | 90.0 | 81.5 | 74.5 | 68.6 |
| 5 to 19 employees | 226,968 | 94.5 | 88.6 | 83.1 | 77.9 |
| 20 to 199 employees | 59,338 | 96.8 | 93.1 | 89.2 | 85.1 |
| 200 or more employees | 4,533 | 97.1 | 94.0 | 91.6 | 89.3 |
| All businesses | 2,539,724 | 86.0 | 75.5 | 68.1 | 61.9 |
Source · ABS, Counts of Australian Businesses, including Entries and Exits, Tables 15 and 16
| Survival of businesses that entered in 2022-23, by employment size range, Australia | ||||
|---|---|---|---|---|
| Employment size at entry | Entries in 2022-23 | Survived to June 2024 (%) | June 2025 (%) | June 2026 (%) |
| Non-employing | 297,302 | 73.1 | 54.0 | 44.6 |
| 1 to 4 employees | 99,446 | 83.2 | 69.2 | 61.1 |
| 5 to 19 employees | 8,359 | 84.9 | 72.7 | 64.7 |
| 20 to 199 employees | 1,189 | 88.4 | 78.4 | 70.6 |
| 200 or more employees | 69 | 92.8 | 82.6 | 78.3 |
| All entries | 406,365 | 75.9 | 58.1 | 49.2 |
Source · ABS, Counts of Australian Businesses, including Entries and Exits, Tables 15 and 16
Section 05 · By industry
Which industries have the most businesses in Australia?
Construction had the most businesses among Australia's 19 industry divisions at 30 June 2026, at 478,651, equivalent to 17.0% of all businesses1. Professional, scientific and technical services was second, at 366,289 businesses, or 13.0%, and rental, hiring and real estate services was third, at 319,717, or 11.4%. Together, these three industries accounted for 41.4% of all businesses.
Construction also recorded the largest increase in 2025-26, adding 15,603 businesses, or 3.4%. It recorded 83,004 entries and 67,401 exits1.
Health care and social assistance recorded the fastest growth rate among the 19 industry divisions in 2025-26, at 6.7%, adding 14,278 businesses to reach 227,7021. It recorded 37,117 entries and 22,839 exits. Transport, postal and warehousing recorded the second-fastest growth rate, at 4.9%, followed by financial and insurance services at 4.3%. Agriculture, forestry and fishing was the only industry division to record fewer businesses in 2025-26, falling by 861 businesses, or 0.5%, to 170,185.
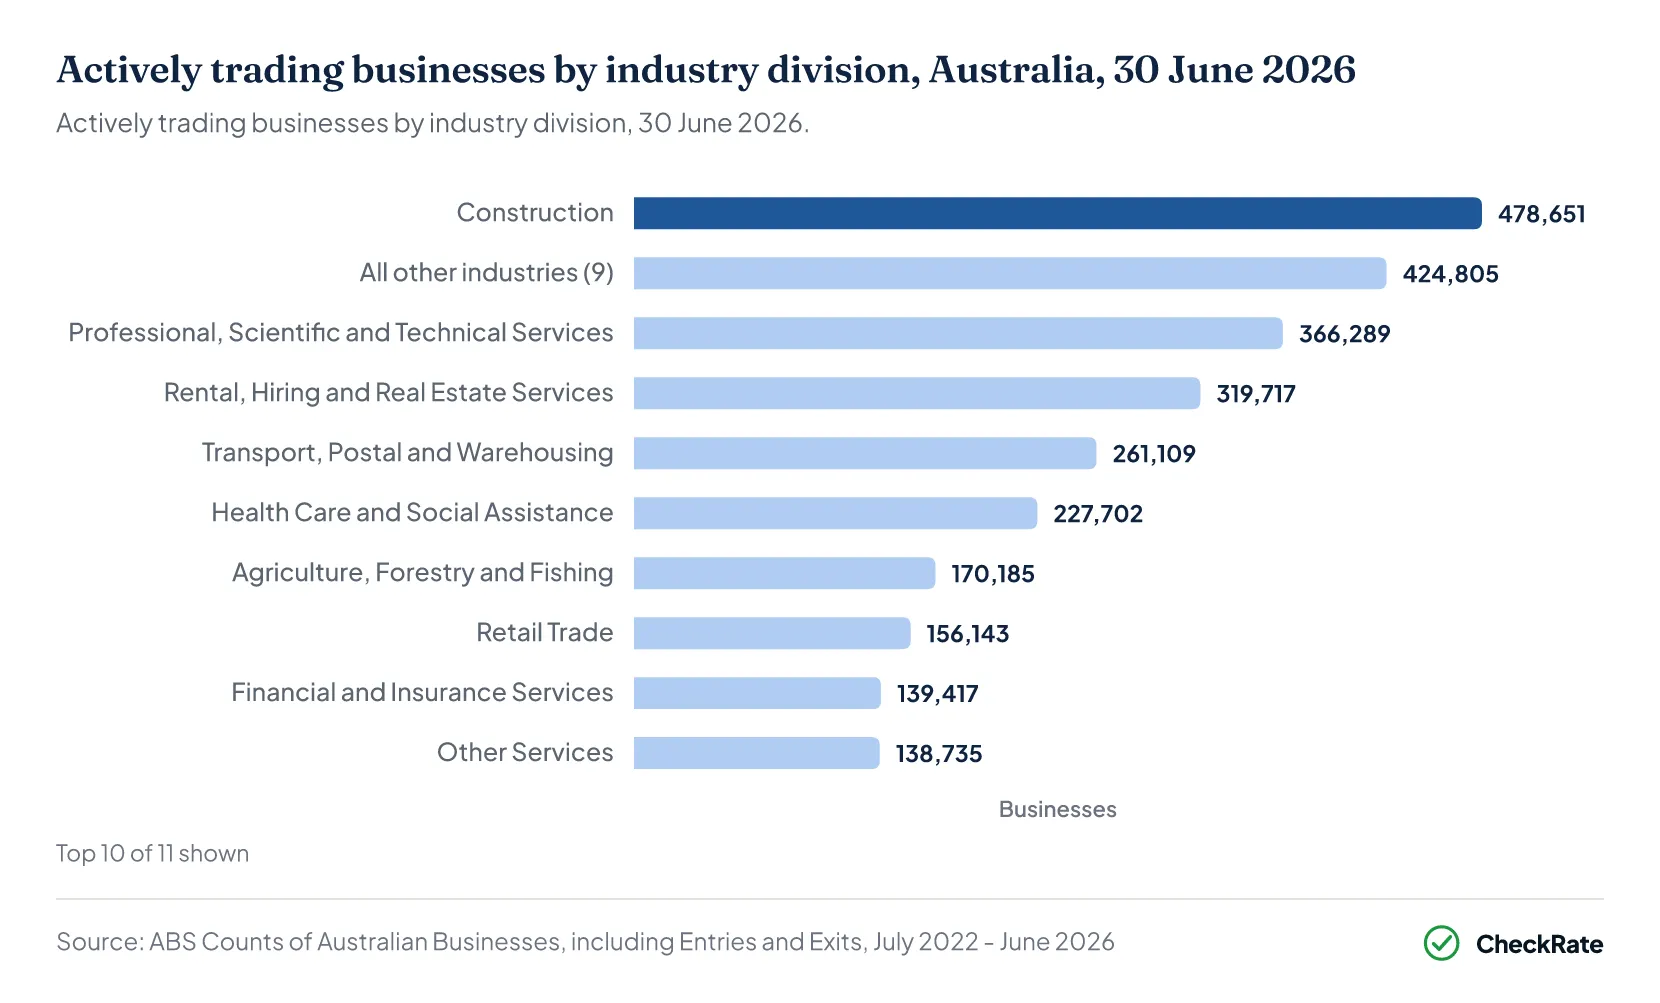
| Businesses by industry division, Australia, 30 June 2026 and change over 2025-26 | ||||
|---|---|---|---|---|
| Industry division | Businesses, 30 June 2026 | Share (%) | Change over 2025-26 | Change (%) |
| Construction | 478,651 | 17.0 | +15,603 | 3.4 |
| Professional, Scientific and Technical Services | 366,289 | 13.0 | +12,804 | 3.6 |
| Rental, Hiring and Real Estate Services | 319,717 | 11.4 | +11,511 | 3.7 |
| Transport, Postal and Warehousing | 261,109 | 9.3 | +12,127 | 4.9 |
| Health Care and Social Assistance | 227,702 | 8.1 | +14,278 | 6.7 |
| Agriculture, Forestry and Fishing | 170,185 | 6.0 | -861 | -0.5 |
| Retail Trade | 156,143 | 5.5 | +125 | 0.1 |
| Financial and Insurance Services | 139,417 | 5.0 | +5,749 | 4.3 |
| Other Services | 138,735 | 4.9 | +4,213 | 3.1 |
| Administrative and Support Services | 130,330 | 4.6 | +3,299 | 2.6 |
| Accommodation and Food Services | 114,369 | 4.1 | +1,498 | 1.3 |
| Manufacturing | 90,879 | 3.2 | +192 | 0.2 |
| Wholesale Trade | 82,448 | 2.9 | +379 | 0.5 |
| Education and Training | 44,236 | 1.6 | +1,190 | 2.8 |
| Arts and Recreation Services | 40,792 | 1.4 | +1,500 | 3.8 |
| Information Media and Telecommunications | 26,250 | 0.9 | +1,002 | 4.0 |
| Electricity, Gas, Water and Waste Services | 9,168 | 0.3 | +280 | 3.2 |
| Mining | 8,755 | 0.3 | +95 | 1.1 |
| Public Administration and Safety | 7,908 | 0.3 | +137 | 1.8 |
| All industries | 2,814,778 | 100.0 | +85,130 | 3.1 |
Source · ABS, Counts of Australian Businesses, including Entries and Exits, Table 1
Section 06 · By jurisdiction
Which states and territories have the most businesses?
New South Wales had the most businesses among Australia's states and territories at 30 June 2026, at 942,658, equivalent to 33.5% of all businesses1. Victoria was second, at 773,986 businesses, or 27.5%, and Queensland was third, at 543,277 businesses, or 19.3%. Together, these three states accounted for 80.3% of all businesses.
New South Wales also recorded the largest increase in the number of businesses in 2025-26, adding 26,057 businesses, or 2.8%1. Victoria's count grew by 2.6% and Queensland's by 3.7%.
Western Australia recorded the fastest growth rate among the states and territories in 2025-26, at 4.6%, adding 12,248 businesses to reach 278,5201. South Australia's count grew by 3.3%, to 174,310 businesses. The Northern Territory's grew by 3.8%, to 17,440 businesses. The Australian Capital Territory's grew by 2.1%, to 37,785 businesses. Tasmania recorded the slowest growth rate, at 1.9%, reaching 45,094 businesses.
| Businesses by state and territory, Australia, 30 June 2026 and change over 2025-26 | ||||
|---|---|---|---|---|
| State or territory | Businesses, 30 June 2026 | Share (%) | Change over 2025-26 | Change (%) |
| New South Wales | 942,658 | 33.5 | +26,057 | 2.8 |
| Victoria | 773,986 | 27.5 | +19,581 | 2.6 |
| Queensland | 543,277 | 19.3 | +19,244 | 3.7 |
| Western Australia | 278,520 | 9.9 | +12,248 | 4.6 |
| South Australia | 174,310 | 6.2 | +5,613 | 3.3 |
| Tasmania | 45,094 | 1.6 | +850 | 1.9 |
| Australian Capital Territory | 37,785 | 1.3 | +789 | 2.1 |
| Northern Territory | 17,440 | 0.6 | +643 | 3.8 |
| Australia | 2,814,778 | 100.0 | +85,130 | 3.1 |
Source · ABS, Counts of Australian Businesses, including Entries and Exits, Table 4
Section 07 · Business structure
What business structures are most common in Australia?
Companies were the most common type of legal organisation for Australian businesses at 30 June 2026, at 1,271,197 businesses, or 45.2% of all businesses1. Sole proprietors, the ABS term for sole traders, were second, at 848,300 businesses, or 30.1%. Trusts numbered 498,865, or 17.7% of all businesses, and partnerships numbered 196,015, or 7.0%.
Companies grew by 5.2% in 2025-26, with 205,319 entries and 141,946 exits, and sole proprietors grew by 3.1%1. Partnerships fell by 4.2%, a decline of 8,682 businesses, while trusts grew by 1.0%. Entries exceeded exits for companies, sole proprietors and trusts in 2025-26, while partnerships recorded 14,222 entries and 22,904 exits.
Companies recorded a higher four-year survival rate than sole proprietors among businesses operating in June 2022, at 66.9% compared with 48.4%1. The four-year survival rate was 65.0% for partnerships and 70.7% for trusts.
The Australian Securities and Investments Commission recorded 385,716 new company registrations in the 12 months to June 2026, based on its monthly counts from July 2025 to June 20263. That was more than the 205,319 company entries recorded by the ABS in 2025-26. A newly registered company is counted as an entry only once it is actively trading and remitting GST.
| Businesses by type of legal organisation and four-year survival rate, Australia, 30 June 2026 | ||||||
|---|---|---|---|---|---|---|
| Type of legal organisation | Businesses, 30 June 2026 | Share (%) | Entries | Exits | Change (%) | Survival, June 2022 to June 2026 (%) |
| Companies | 1,271,197 | 45.2 | 205,319 | 141,946 | 5.2 | 66.9 |
| Sole proprietors | 848,300 | 30.1 | 188,856 | 163,429 | 3.1 | 48.4 |
| Trusts | 498,865 | 17.7 | 52,045 | 47,036 | 1.0 | 70.7 |
| Partnerships | 196,015 | 7.0 | 14,222 | 22,904 | -4.2 | 65.0 |
| Public sector | 401 | 0.0 | 19 | 16 | 0.8 | 85.1 |
| All businesses | 2,814,778 | 100.0 | 460,461 | 375,331 | 3.1 | 61.9 |
Source · ABS, Counts of Australian Businesses, including Entries and Exits, Tables 10 and 11
Section 08 · Since 2022
How has the number of Australian businesses changed since 2022?
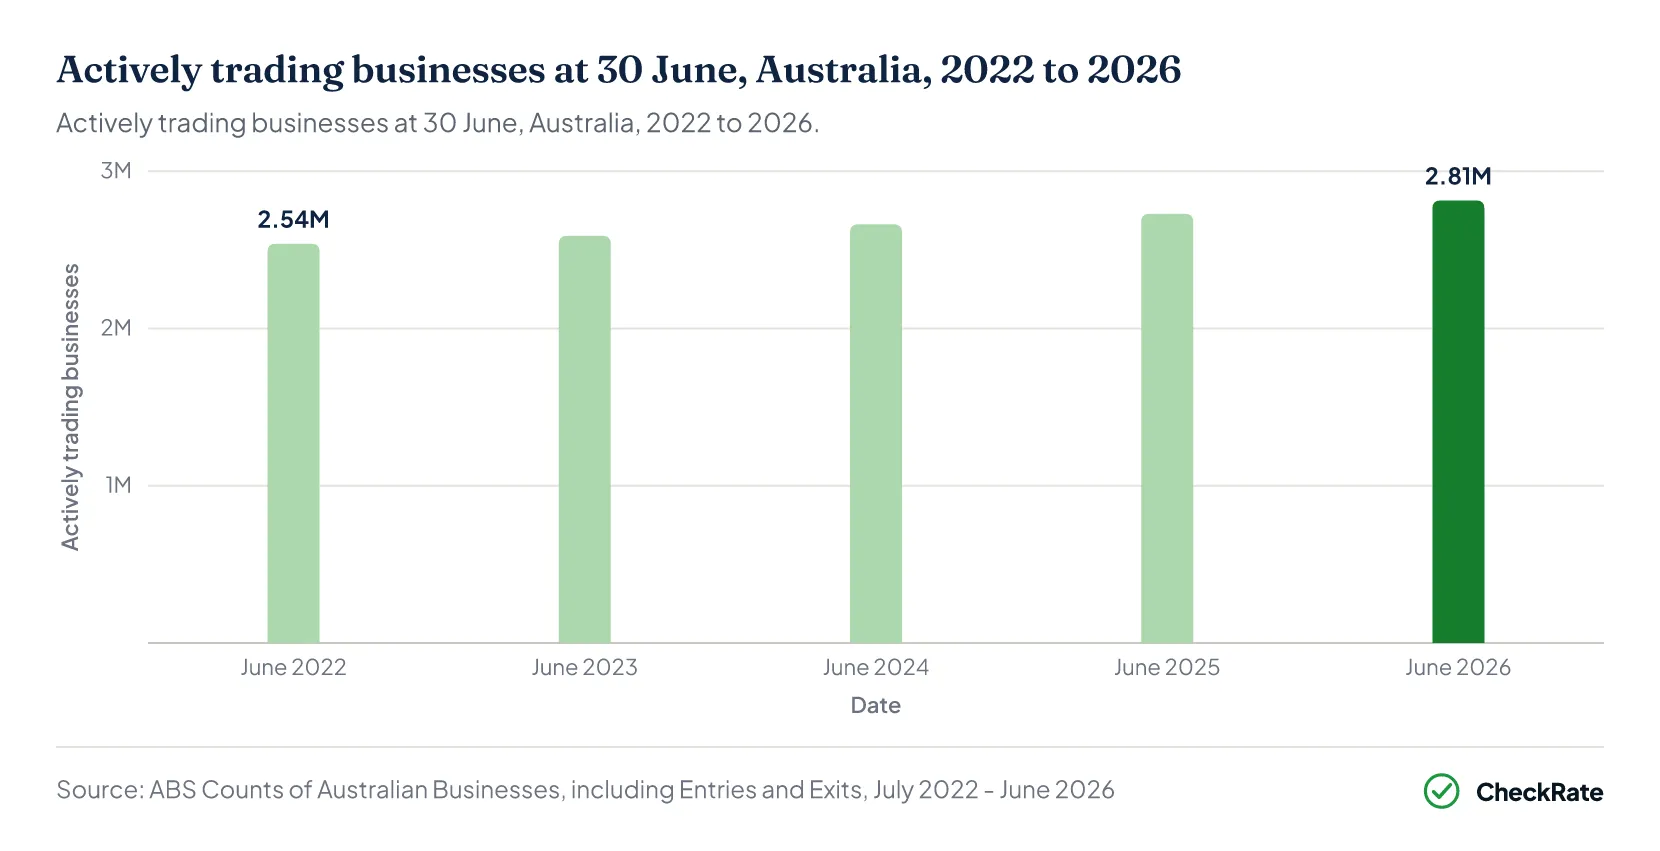
The number of actively trading businesses grew from 2,539,724 at 30 June 2022 to 2,814,778 at 30 June 2026, an increase of 275,054 businesses, or 10.8%, over four years1. The annual growth rate was 2.0% in 2022-23 and 2.8% in 2023-24. Growth was 2.5% in 2024-25 and rose to 3.1% in 2025-26, the fastest annual rate over the four years.
Entries rose from 406,365 in 2022-23 to 460,461 in 2025-26, and exits rose from 356,216 in 2022-23 to 375,331 in 2025-261. The entry rate increased from 16.0% to 16.9% over the same period, while the exit rate fell from 14.0% to 13.8%.
Non-employing businesses grew by 19.5% between June 2022 and June 2026, from 1,521,428 to 1,818,5751. Employing businesses fell by 2.2% over the same four years, from 1,018,296 to 996,203. The net increase of 275,054 businesses since June 2022 came entirely from non-employing businesses. They added 297,147 businesses over the four years, while employing businesses fell by 22,093.
Non-employing businesses accounted for 59.9% of all businesses in June 2022 and 64.6% in June 20261. Over the same period, the share of employing businesses fell from 40.1% to 35.4%.
| Businesses operating, entries, exits and rates, Australia, 2022-23 to 2025-26 | |||||||
|---|---|---|---|---|---|---|---|
| Financial year | Operating at start | Entries | Exits | Operating at end | Change (%) | Entry rate (%) | Exit rate (%) |
| 2022-23 | 2,539,724 | 406,365 | 356,216 | 2,589,873 | 2.0 | 16.0 | 14.0 |
| 2023-24 | 2,589,873 | 436,018 | 362,893 | 2,662,998 | 2.8 | 16.8 | 14.0 |
| 2024-25 | 2,662,998 | 437,150 | 370,500 | 2,729,648 | 2.5 | 16.4 | 13.9 |
| 2025-26 | 2,729,648 | 460,461 | 375,331 | 2,814,778 | 3.1 | 16.9 | 13.8 |
Source · ABS, Counts of Australian Businesses, including Entries and Exits, Table 13
Section 09
Business counts: quick answers
How many small businesses are there in Australia?
Businesses with fewer than 20 employees numbered 2,741,087 at 30 June 2026, or 97.4% of the 2,814,778 actively trading businesses1. Of these, 1,818,575 had no employees. The Australian Bureau of Statistics does not publish a small-business count. This page uses its employment-size bands, with fewer than 20 employees as small.
How many businesses fail each year in Australia?
Business exits numbered 375,331 in 2025-26, an exit rate of 13.8%, according to the Australian Bureau of Statistics1. An exit includes cancellations and businesses that stopped remitting GST, so it is not a count of failures. Companies entering external administration for the first time numbered 14,153 in 2025-26, according to the Australian Securities and Investments Commission4.
What percentage of new businesses survive in Australia?
Of the 406,365 businesses that entered in 2022-23, 49.2% were still actively trading at 30 June 2026, three years later, according to the Australian Bureau of Statistics1. The three-year survival rate was 44.6% for new non-employing businesses and 61.1% for new businesses with 1 to 4 employees.
How many companies are registered in Australia?
The Australian Securities and Investments Commission recorded 3,747,198 registered companies at 30 June 20263, while the Australian Bureau of Statistics counted 1,271,197 companies among actively trading businesses on the same date1. The ABS counts only companies that were actively trading and remitting GST.
How many businesses are there in New South Wales?
New South Wales had 942,658 actively trading businesses at 30 June 2026, or 33.5% of the 2,814,778 businesses in Australia, according to the Australian Bureau of Statistics1. Victoria had 773,986 businesses, while Queensland had 543,277 businesses.
Are most Australian businesses sole traders?
No. Companies were the most common type of legal organisation at 30 June 2026, at 1,271,197 businesses, or 45.2% of all businesses, according to the Australian Bureau of Statistics1. Sole proprietors, the ABS term for sole traders, numbered 848,300, or 30.1% of all businesses.
References
- ABS, Counts of Australian Businesses, including Entries and Exits, July 2022 to June 2026 · Australian Bureau of Statistics ↑ b c d e f g h i j k l m n o p q r s t u v w x y z a2 b2 c2 d2 e2 f2 g2
- ABS, Counts of Australian Businesses, including Entries and Exits methodology, July 2022 to June 2026 · Australian Bureau of Statistics ↑ b c
- ASIC, Company registration statistics · asic.gov.au ↑ b c
- ASIC, Australian insolvency statistics, Series 1 and Series 2, published 7 September 2026 · download.asic.gov.au ↑ b