


Published
Section 01 · 2025-26
How many companies entered external administration in 2025-26?
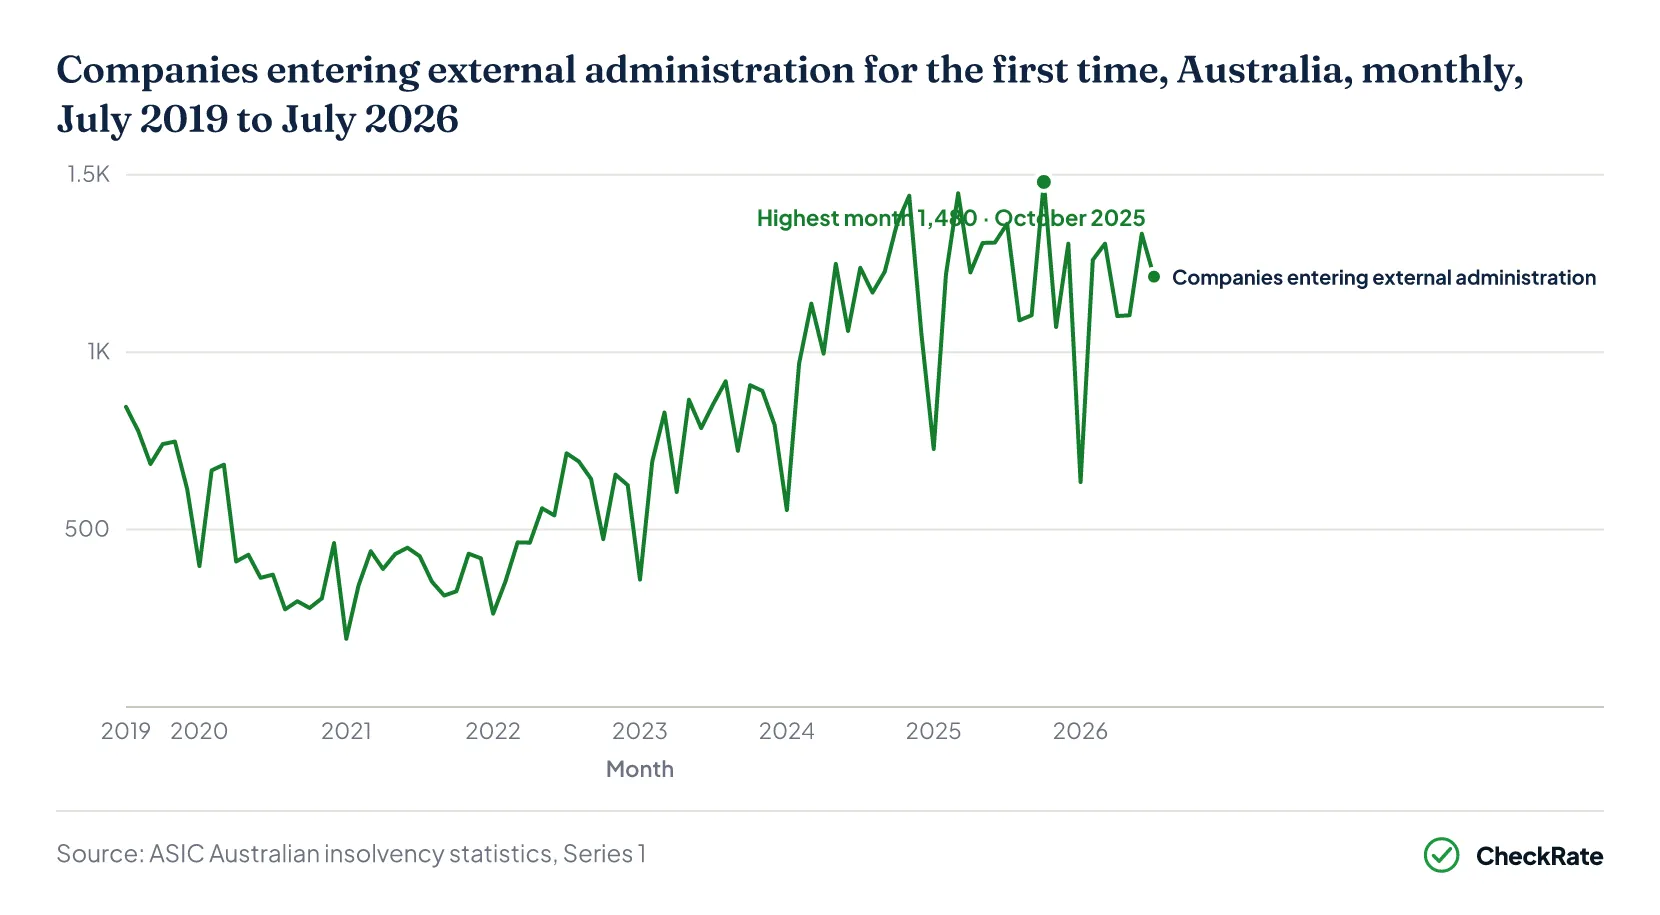
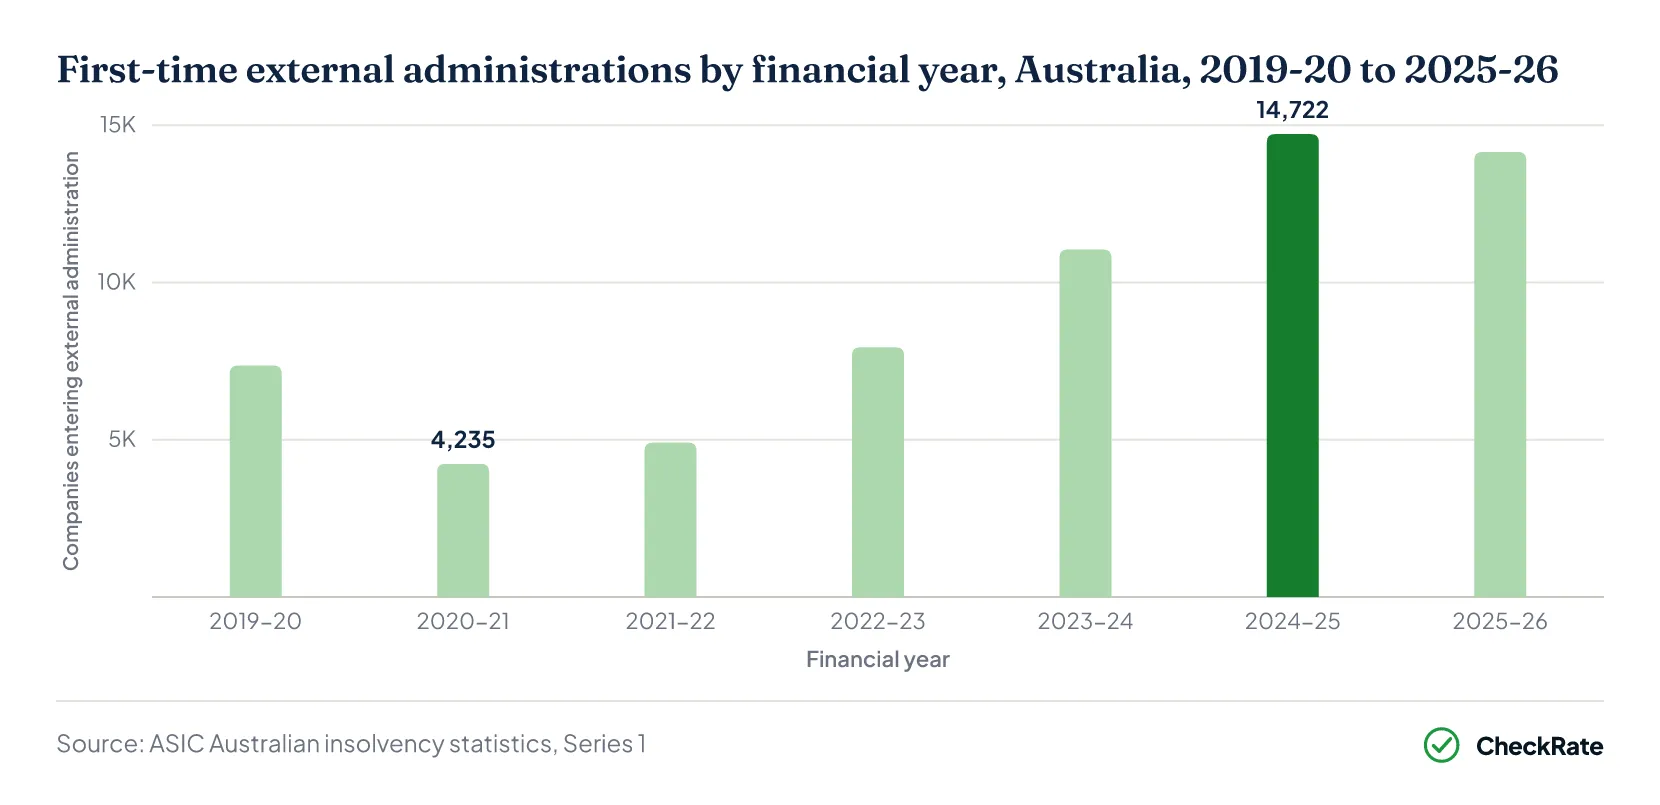
A total of 14,153 companies entered external administration or had a controller appointed for the first time in the 2025-26 financial year, according to the Australian Securities and Investments Commission (ASIC) Australian insolvency statistics.1 This was 569 fewer companies, or 3.9% fewer, than the 14,722 recorded in 2024-25.
The monthly totals ranged from 1,071 to 1,480 throughout 2025-26 except in January 2026, when the total was 634.1
The 14,153 companies entering external administration in 2025-26 were equivalent to 0.38% of the 3,747,198 companies registered at 30 June 2026, or 3.8 companies per 1,000 registered.2 The same ratio was 0.33% in 2023-24 and 0.41% in 2024-25.3 ASIC's Corporate Insolvency Update reports that its highest published ratios were 0.56% in 2011-12 and 0.53% in 2012-13.
Section 02 · Appointment types
What types of external administration appointment are most common?
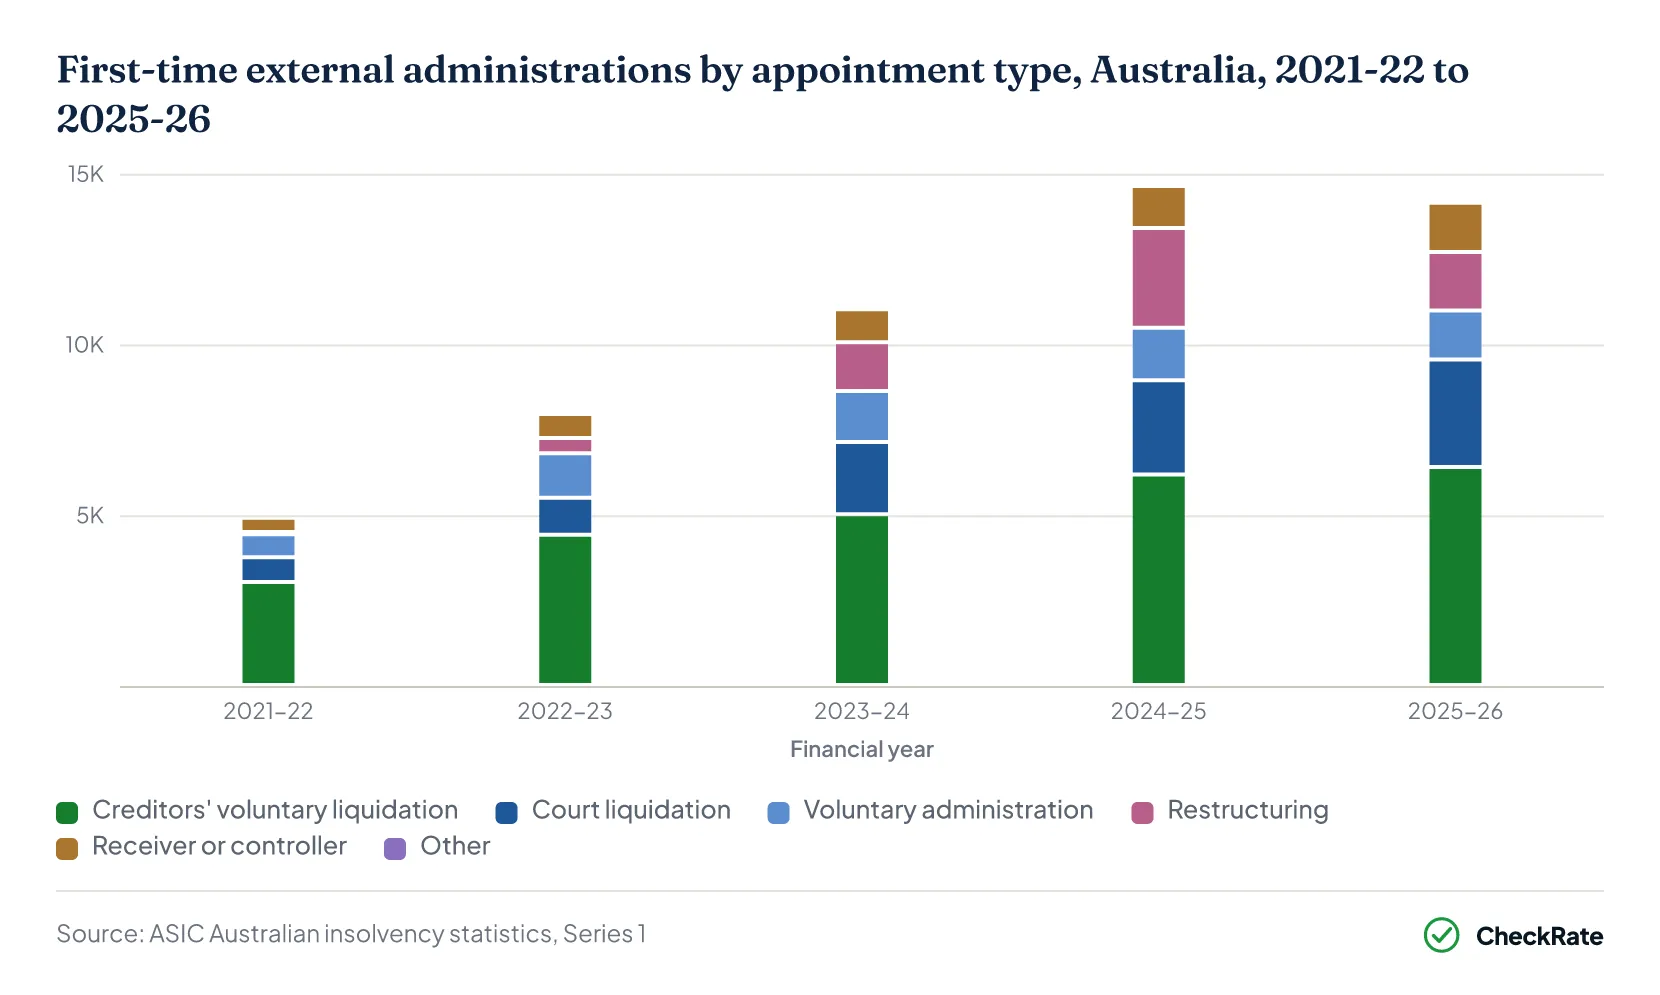
Creditors' voluntary liquidations were the most common type of first appointment in 2025-26, accounting for 6,386 companies, or 45.1% of the 14,153 companies entering external administration.1 Court liquidations were second, at 3,144 companies, or 22.2%. Creditors' voluntary and court liquidations together accounted for 67.3% of first appointments in 2025-26.
Restructuring was the first appointment type for 1,714 companies in 2025-26, or 12.1%, and voluntary administrations accounted for 1,435, or 10.1%.1 Receiver, receiver and manager, controller and managing controller appointments together accounted for 1,444 companies, or 10.2%. Provisional liquidations numbered 30 companies.
Restructuring appointments increased from 70 in 2021-22, the first full year of the small business restructuring process, to 2,918 in 2024-25.1 The number fell to 1,714 in 2025-26, a decline of 41.3%.
Court liquidations rose from 2,762 companies in 2024-25 to 3,144 in 2025-26, an increase of 13.8%.1 Companies entering creditors' voluntary liquidation rose from 6,164 to 6,386 over the same two years, an increase of 3.6%. Companies entering voluntary administration decreased from 1,540 to 1,435, a decline of 6.8%.
| First-time external administrations by appointment type, Australia, 2024-25 and 2025-26 | |||
|---|---|---|---|
| Appointment type | 2024-25 | 2025-26 | Share of 2025-26 (%) |
| Creditors' voluntary liquidation | 6,164 | 6,386 | 45.1 |
| Court liquidation | 2,762 | 3,144 | 22.2 |
| Restructuring | 2,918 | 1,714 | 12.1 |
| Voluntary administration | 1,540 | 1,435 | 10.1 |
| Receiver and manager appointed | 480 | 526 | 3.7 |
| Receiver appointed | 357 | 494 | 3.5 |
| Controller appointed | 393 | 419 | 3.0 |
| Provisional liquidation | 106 | 30 | 0.2 |
| Managing controller appointed | 1 | 5 | 0.0 |
| Scheme administrator appointed | 1 | 0 | 0.0 |
| All appointment types | 14,722 | 14,153 | 100.0 |
Source · ASIC, Australian insolvency statistics, Series 1, Table 1.1.
Section 03 · By industry
Which industries had the most companies entering external administration in 2025-26?
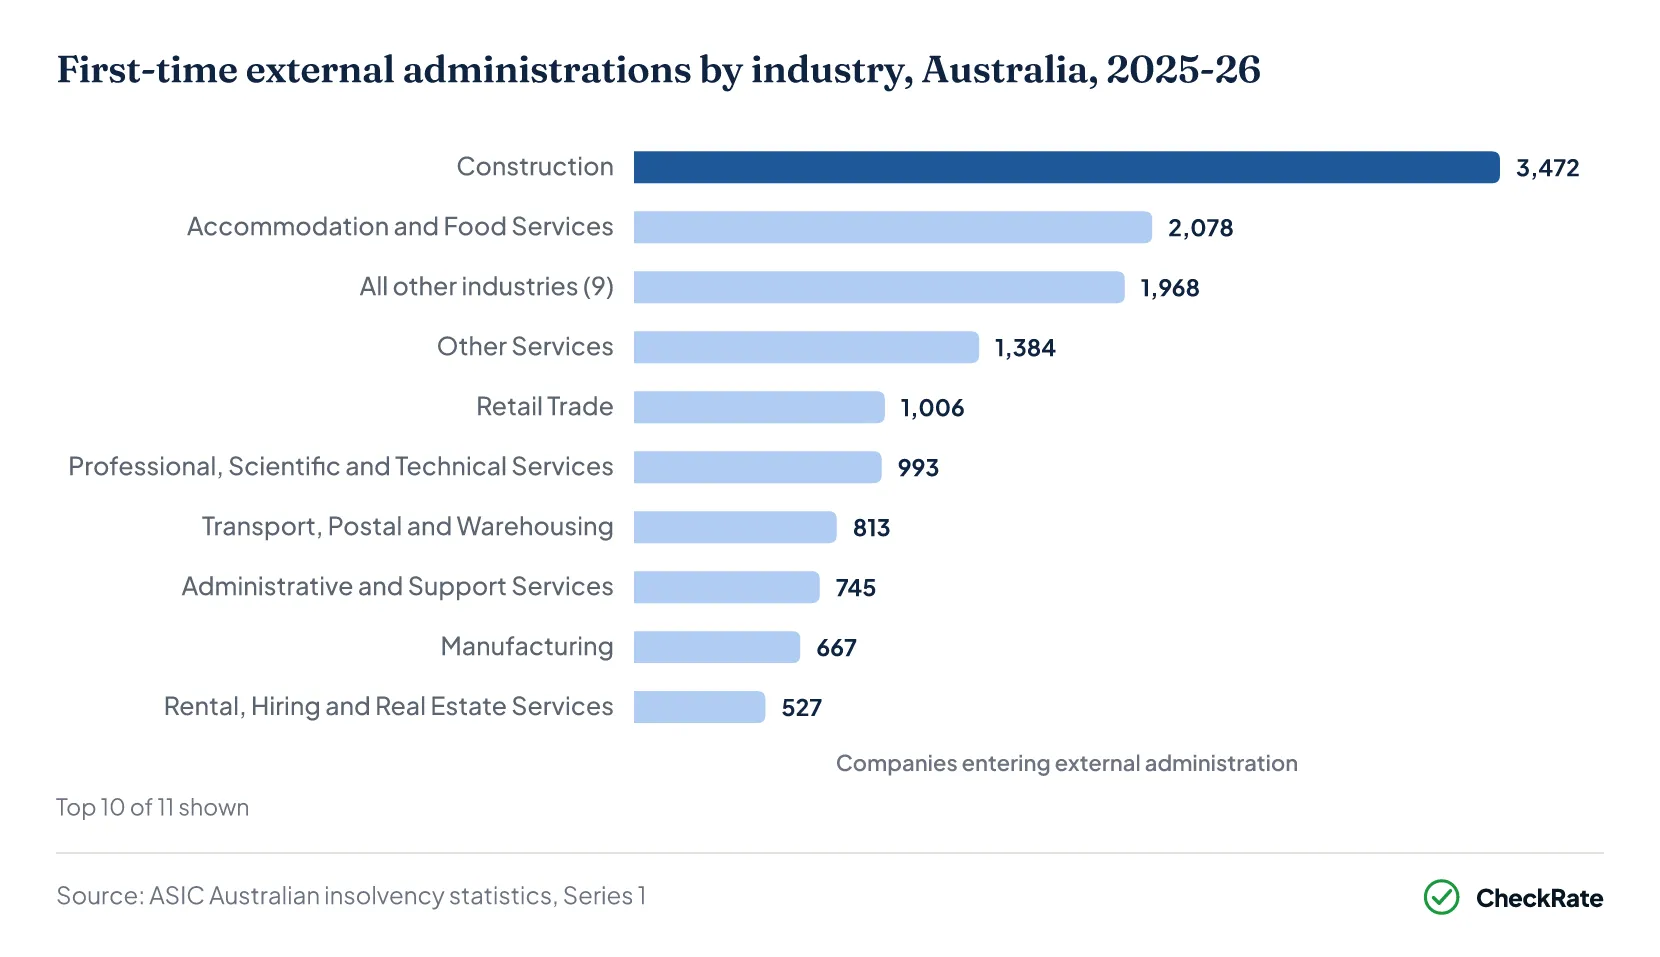
Construction had the most companies entering external administration in Australia in 2025-26, at 3,472, or 24.5% of the 14,153 companies entering external administration.1 Accommodation and food services was second, at 2,078 companies, or 14.7%, and other services was third, at 1,384 companies, or 9.8%. Together, these three industries accounted for 49.0% of the companies that entered external administration in 2025-26.
Retail trade recorded the largest increase between 2024-25 and 2025-26, of 135 companies, from 871 to 1,006.1 Accommodation and food services recorded the largest fall, down 398 companies, from 2,476 to 2,078. Construction fell from 3,596 companies in 2024-25 to 3,472 in 2025-26. Of the 19 industries, six recorded an increase and 13 recorded a decrease.
| First-time external administrations by industry, Australia, 2024-25 and 2025-26 | ||||
|---|---|---|---|---|
| Industry | 2024-25 | 2025-26 | Share of 2025-26 (%) | Change |
| Construction | 3,596 | 3,472 | 24.5 | -124 |
| Accommodation and Food Services | 2,476 | 2,078 | 14.7 | -398 |
| Other Services | 1,506 | 1,384 | 9.8 | -122 |
| Retail Trade | 871 | 1,006 | 7.1 | +135 |
| Professional, Scientific and Technical Services | 1,010 | 993 | 7.0 | -17 |
| Transport, Postal and Warehousing | 734 | 813 | 5.7 | +79 |
| Administrative and Support Services | 799 | 745 | 5.3 | -54 |
| Manufacturing | 636 | 667 | 4.7 | +31 |
| Rental, Hiring and Real Estate Services | 567 | 527 | 3.7 | -40 |
| Health Care and Social Assistance | 481 | 464 | 3.3 | -17 |
| Financial and Insurance Services | 438 | 433 | 3.1 | -5 |
| Arts and Recreation Services | 262 | 281 | 2.0 | +19 |
| All other industries (7) and unknown | 1,346 | 1,290 | 9.1 | -56 |
| All industries | 14,722 | 14,153 | 100.0 | -569 |
Source · ASIC, Australian insolvency statistics, Series 1, Table 1.2.
Section 04 · By state
Which states and territories had the most companies entering external administration?
New South Wales had the largest number of companies entering external administration in Australia in 2025-26, at 5,367 companies, or 37.9% of the 14,153 companies that entered external administration in Australia.1 Victoria was second, at 4,100 companies, or 29.0%, and Queensland was third, at 2,706 companies, or 19.1%. Together, these three states accounted for 86.0% of the companies that entered external administration in 2025-26.
Relative to the number of registered companies, the Northern Territory had the highest rate, at 5.4 first appointments per 1,000 registered companies in 2025-26, based on company registrations at 30 June 2026.2 New South Wales recorded 4.3 companies per 1,000, Victoria recorded 3.6 and Queensland recorded 3.9. Western Australia recorded the lowest rate, at 2.5 per 1,000.
This comparison has a limitation: the counts of companies entering external administration use the company's principal place of business4, while the registration counts use the state of registration.
The number of companies entering external administration in New South Wales fell by 5.7% in 2025-26, from 5,692 to 5,367.1 Victoria recorded a 3.3% fall, from 4,242 to 4,100, while Queensland recorded a 0.5% increase, from 2,693 to 2,706.
| First-time external administrations by state and territory and per 1,000 registered companies, Australia, 2024-25 and 2025-26 | |||||
|---|---|---|---|---|---|
| State or territory | 2024-25 | 2025-26 | Share of 2025-26 (%) | Registered companies, June 2026 | Per 1,000 registered |
| New South Wales | 5,692 | 5,367 | 37.9 | 1,260,753 | 4.3 |
| Victoria | 4,242 | 4,100 | 29.0 | 1,147,105 | 3.6 |
| Queensland | 2,693 | 2,706 | 19.1 | 692,024 | 3.9 |
| Western Australia | 929 | 830 | 5.9 | 331,351 | 2.5 |
| South Australia | 645 | 652 | 4.6 | 195,321 | 3.3 |
| Australian Capital Territory | 286 | 256 | 1.8 | 64,526 | 4.0 |
| Tasmania | 143 | 145 | 1.0 | 38,227 | 3.8 |
| Northern Territory | 92 | 97 | 0.7 | 17,823 | 5.4 |
| Australia | 14,722 | 14,153 | 100.0 | 3,747,198 | 3.8 |
Source · ASIC, Australian insolvency statistics, Series 1, Table 1.3; ASIC, company registration statistics.
Section 05 · Causes
What are the most common causes of company failure in Australia?
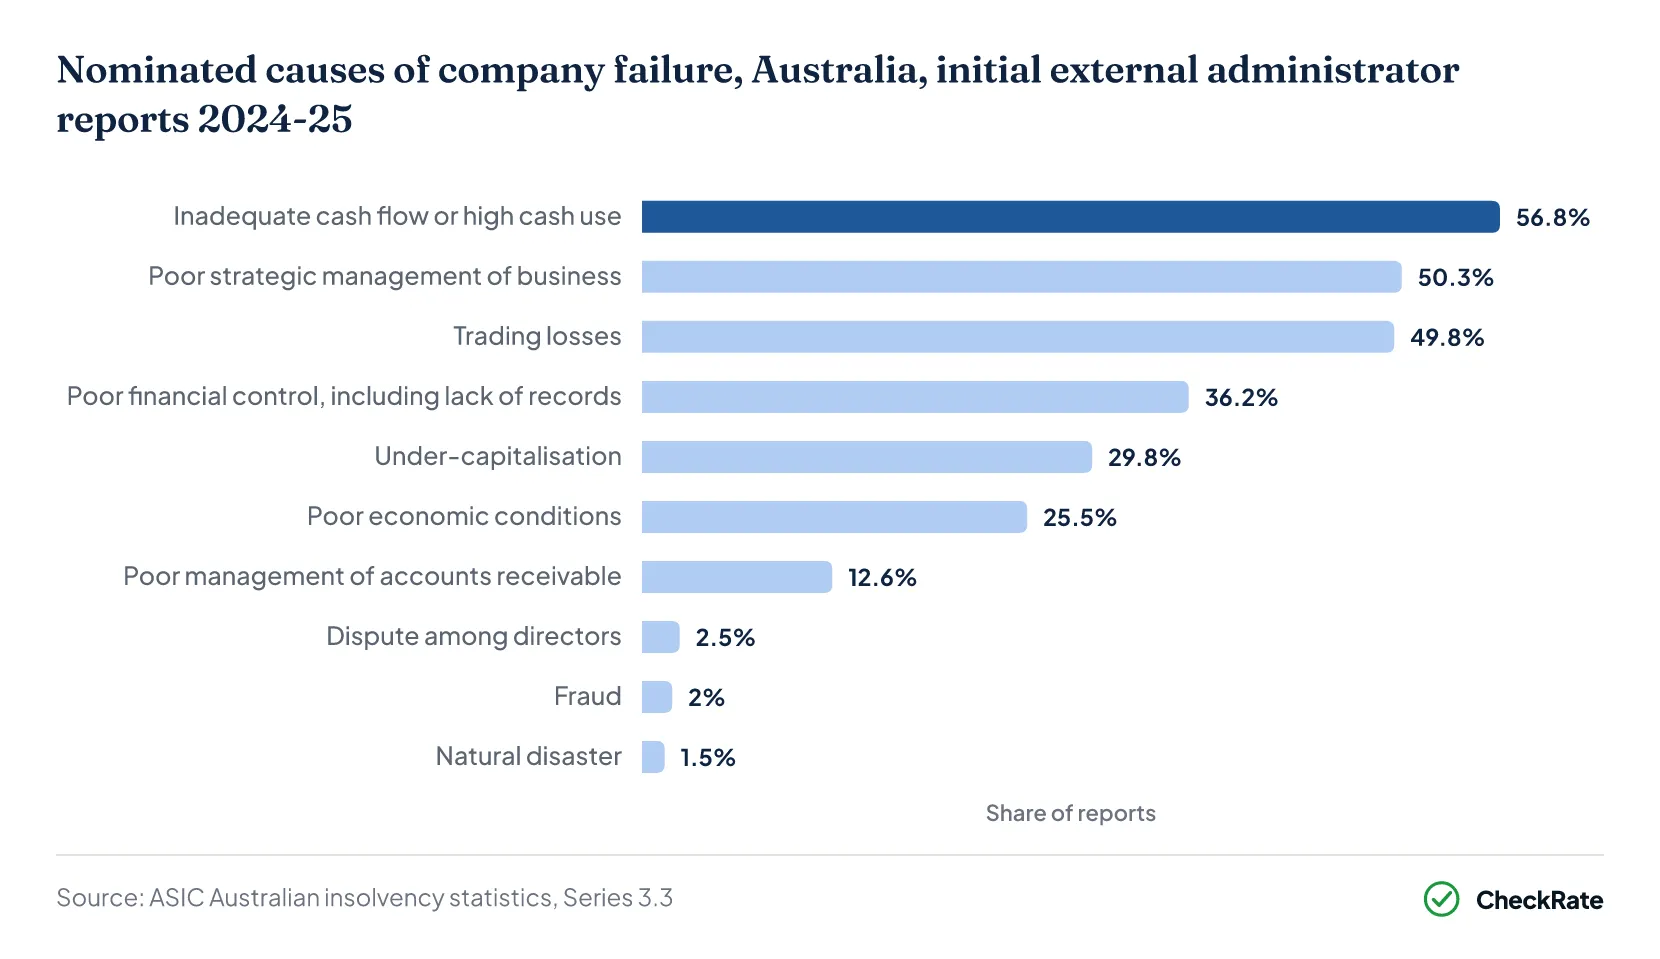
Inadequate cash flow or high cash use was the most commonly nominated cause of failure in initial reports lodged by external administrators in 2024-25. It was nominated in 5,446 of the 9,585 reports, or 56.8%.5 Poor strategic management of the business was second, at 4,824 reports, or 50.3%, followed by trading losses at 4,772 reports, or 49.8%.
Other commonly nominated causes included poor financial control, including a lack of records, in 3,470 reports, or 36.2%.5 Under-capitalisation was nominated in 2,861 reports, or 29.8%, and poor economic conditions in 2,440 reports, or 25.5%.
External administrators can nominate more than one cause in a report. Across the 9,585 reports lodged in 2024-25, 29,626 causes were nominated, an average of about 3.1 per report. The percentages therefore do not add to 100%.5
Less commonly nominated causes included disputes among directors, recorded in 235 reports, or 2.5%.5 Fraud was nominated in 193 reports, or 2.0%, and natural disaster was nominated in 146 reports, or 1.5%.
The reports are the initial statutory reports liquidators, administrators and receivers lodge after their appointment4, so they cover a different population from ASIC's first-appointment company counts.
Section 06 · Company size
How large are the companies in external administrators' initial reports?
Companies with fewer than five full-time equivalent employees accounted for 6,101 of the 9,585 initial external administrator reports lodged in 2024-25, or 63.7%.5 Companies with 5 to 19 employees accounted for 1,270 reports, or 13.2%. Companies with 20 to 199 employees accounted for 379 reports, or 4.0%, and companies with 200 or more employees accounted for 14 reports, or 0.1%. The employee count was not known for 1,821 reports, or 19.0%.
Estimated assets of less than $1 were recorded in 3,261 reports, or 34.0%. Overall, 5,586 reports, or 58.3%, recorded estimated assets of $10,000 or less, including those with assets below $1.5 Estimated assets of $1 million or more were recorded in 347 reports, or 3.6%. Estimated liabilities were between $250,001 and $1 million in 3,602 reports, or 37.6%, and $1 million or more in 31.3% of reports.
Unsecured creditors were estimated to receive nothing in 7,978 reports, or 83.2% of all reports lodged in 2024-25.5 A dividend of 51 cents in the dollar or more was estimated in 84 reports, or 0.9%. Fewer than 25 unsecured creditors were listed in 7,637 reports, or 79.7%.
Unpaid taxes and other statutory charges of more than $1 million were recorded in 902 reports, or 9.4%.5
| Initial external administrator reports by size of company and estimated dividend to unsecured creditors, Australia, reports lodged in 2024-25 | ||
|---|---|---|
| Measure | Reports | Share of reports (%) |
| Full-time equivalent employees | ||
| Fewer than 5 | 6,101 | 63.7 |
| 5 to 19 | 1,270 | 13.2 |
| 20 to 199 | 379 | 4.0 |
| 200 or more | 14 | 0.1 |
| Not known | 1,821 | 19.0 |
| All reports | 9,585 | 100.0 |
| Estimated dividend to unsecured creditors, cents in the dollar | ||
| 0 cents | 7,978 | 83.2 |
| More than 0 but less than 11 cents | 423 | 4.4 |
| 11 to 20 cents | 127 | 1.3 |
| 21 to 50 cents | 117 | 1.2 |
| 51 to 100 cents | 84 | 0.9 |
| Not applicable | 856 | 8.9 |
| All reports | 9,585 | 100.0 |
Source · ASIC, Australian insolvency statistics, Series 3.3, Tables 3.3.4 and 3.3.13.
Section 07 · Personal insolvencies
How many business-related personal insolvencies are there in Australia?
Australia recorded 3,536 people entering personal insolvency with a business involvement in 2024-25, equivalent to 28.8% of the 12,257 people who entered personal insolvency that year, according to the Australian Financial Security Authority (AFSA) statistics.6
The 3,536 people comprised 3,119 bankruptcies, 302 debt agreements, 111 personal insolvency agreements and four insolvent deceased estates.6 Across all 12,257 personal insolvencies, there were 6,930 bankruptcies, 5,093 debt agreements, 210 personal insolvency agreements and 24 insolvent deceased estates. Among the 6,930 bankruptcies, 3,119, or 45.0%, involved a person with a business involvement, compared with 302 of the 5,093 debt agreements.
AFSA counts a personal insolvency as business-related when the person states that they traded as a sole trader or contractor, were in a partnership, or were a director, secretary or manager of a company during the relevant period before the insolvency.6
AFSA counts people, not businesses. A sole trader's business failure is counted by AFSA, not in ASIC's company counts.
Section 08 · Since 2019-20
How have first-time external administrations changed since 2019-20?
Companies entering external administration for the first time fell from 7,362 in 2019-20 to 4,235 in 2020-21.1 This was the lowest annual total among the seven financial years from 2019-20 to 2025-26.
The number then increased in each of the next four financial years, to 4,912 in 2021-22, 7,942 in 2022-23, 11,053 in 2023-24 and 14,722 in 2024-25.1 The 2024-25 total was the highest of the seven years, and the number fell to 14,153 in 2025-26. The growth rate was 39.2% in 2023-24 and 33.2% in 2024-25.
Temporary insolvency relief measures were in force from 25 March 2020 to 31 December 2020.7 In July 2026, the first month of 2026-27, 1,213 companies entered external administration, 10.9% fewer than the 1,362 companies recorded in July 2025.1 A month's count is provisional until the next release, after which ASIC does not revise it for later lodgements or withdrawals.4
The number of registered companies grew from 2,915,869 at 30 June 2021 to 3,747,198 at 30 June 2026.2 First-time external administrations were equivalent to 0.15% in 2020-21, 0.33% in 2023-24, 0.41% in 2024-25 and 0.38% in 2025-26.
| First-time external administrations, registered companies and the ratio between them, Australia, 2020-21 to 2025-26 | |||
|---|---|---|---|
| Financial year | Companies entering external administration | Registered companies at 30 June | Ratio (%) |
| 2020-21 | 4,235 | 2,915,869 | 0.15 |
| 2021-22 | 4,912 | 3,085,762 | 0.16 |
| 2022-23 | 7,942 | 3,227,484 | 0.25 |
| 2023-24 | 11,053 | 3,388,934 | 0.33 |
| 2024-25 | 14,722 | 3,564,367 | 0.41 |
| 2025-26 | 14,153 | 3,747,198 | 0.38 |
Source · ASIC, Australian insolvency statistics, Series 1, Table 1; ASIC, company registration statistics.
How business exits compare with the total number of businesses is covered in the business counts article.
Section 09
Business insolvencies: quick answers
How many businesses became insolvent in Australia in 2025-26?
A total of 14,153 companies entered external administration or had a controller appointed for the first time in the 2025-26 financial year, according to the Australian Securities and Investments Commission (ASIC). This was 3.9% fewer than the 14,722 recorded in 2024-25. Entering external administration is not the same as being insolvent, and the count covers companies only, not sole traders or partnerships.
What percentage of Australian companies fail each year?
Companies entering external administration for the first time in 2025-26 were equivalent to 0.38% of the 3,747,198 companies registered at 30 June 2026, according to ASIC, and the ratio was 0.33% in 2023-24 and 0.41% in 2024-25. The figures include several forms of external administration and exclude solvent wind-ups, so they are not a measure of the percentage of companies that became insolvent.
Which industry has the most insolvencies in Australia?
Construction recorded the largest number of companies entering external administration among the 19 industries ASIC reports, at 3,472 of the 14,153 companies that entered external administration in 2025-26, equivalent to 24.5%. Accommodation and food services was second, at 2,078 companies.
What is the most common cause of company failure?
Inadequate cash flow or high cash use was the most commonly nominated cause in initial external administrator reports lodged in 2024-25, appearing in 56.8% of the 9,585 reports. External administrators can nominate more than one cause per report, and poor strategic management of the business was nominated in 50.3%.
How much do unsecured creditors get back when a company fails?
Unsecured creditors were estimated to receive nothing in 83.2% of the initial external administrator reports lodged in 2024-25, according to ASIC. A dividend of 51 cents in the dollar or more was estimated in 0.9% of reports.
Is a creditors' voluntary liquidation the same as a company going broke?
No. A creditors' voluntary liquidation is one of several forms of external administration ASIC counts, and it accounted for 45.1% of first appointments in 2025-26. Solvent companies that wind up through a members' voluntary liquidation are counted separately and are not among the 14,153 companies entering external administration.
References
- ASIC, Australian insolvency statistics, Series 1 and Series 2, published 7 September 2026 · download.asic.gov.au ↑ b c d e f g h i j k l m n o
- ASIC, Company registration statistics · asic.gov.au ↑ b c
- ASIC, Corporate Insolvency Update, Issue 37 · asic.gov.au ↑
- ASIC — Information Sheet 80: How to interpret ASIC's corporate insolvency statistics · asic.gov.au ↑ b c
- ASIC, Australian insolvency statistics, Series 3.3, external administrators' and receivers' reports time series 2004-05 to 2024-25 · download.asic.gov.au ↑ b c d e f g h i
- AFSA, Quarterly personal insolvency statistics · afsa.gov.au ↑ b c d
- ASIC, Directors duties in the context of COVID-19 · asic.gov.au ↑