

Published
Section 01 · Owners
How many taxpayers own a rental property in Australia?
Rental property ownership is measured in the ATO's annual Taxation statistics, and on the rental schedule basis 2,335,540 people held an interest in a rental property in 2023–24. That was 14.1 per cent of the 16,584,287 people who lodged an individual tax return that year, a derived share of about one in seven1. The tax return's net rent label counted 2,332,653 people, a difference of about 0.1 per cent from the schedule count. A person with any share of a property counts as having an interest, so these are counts of people, not properties.
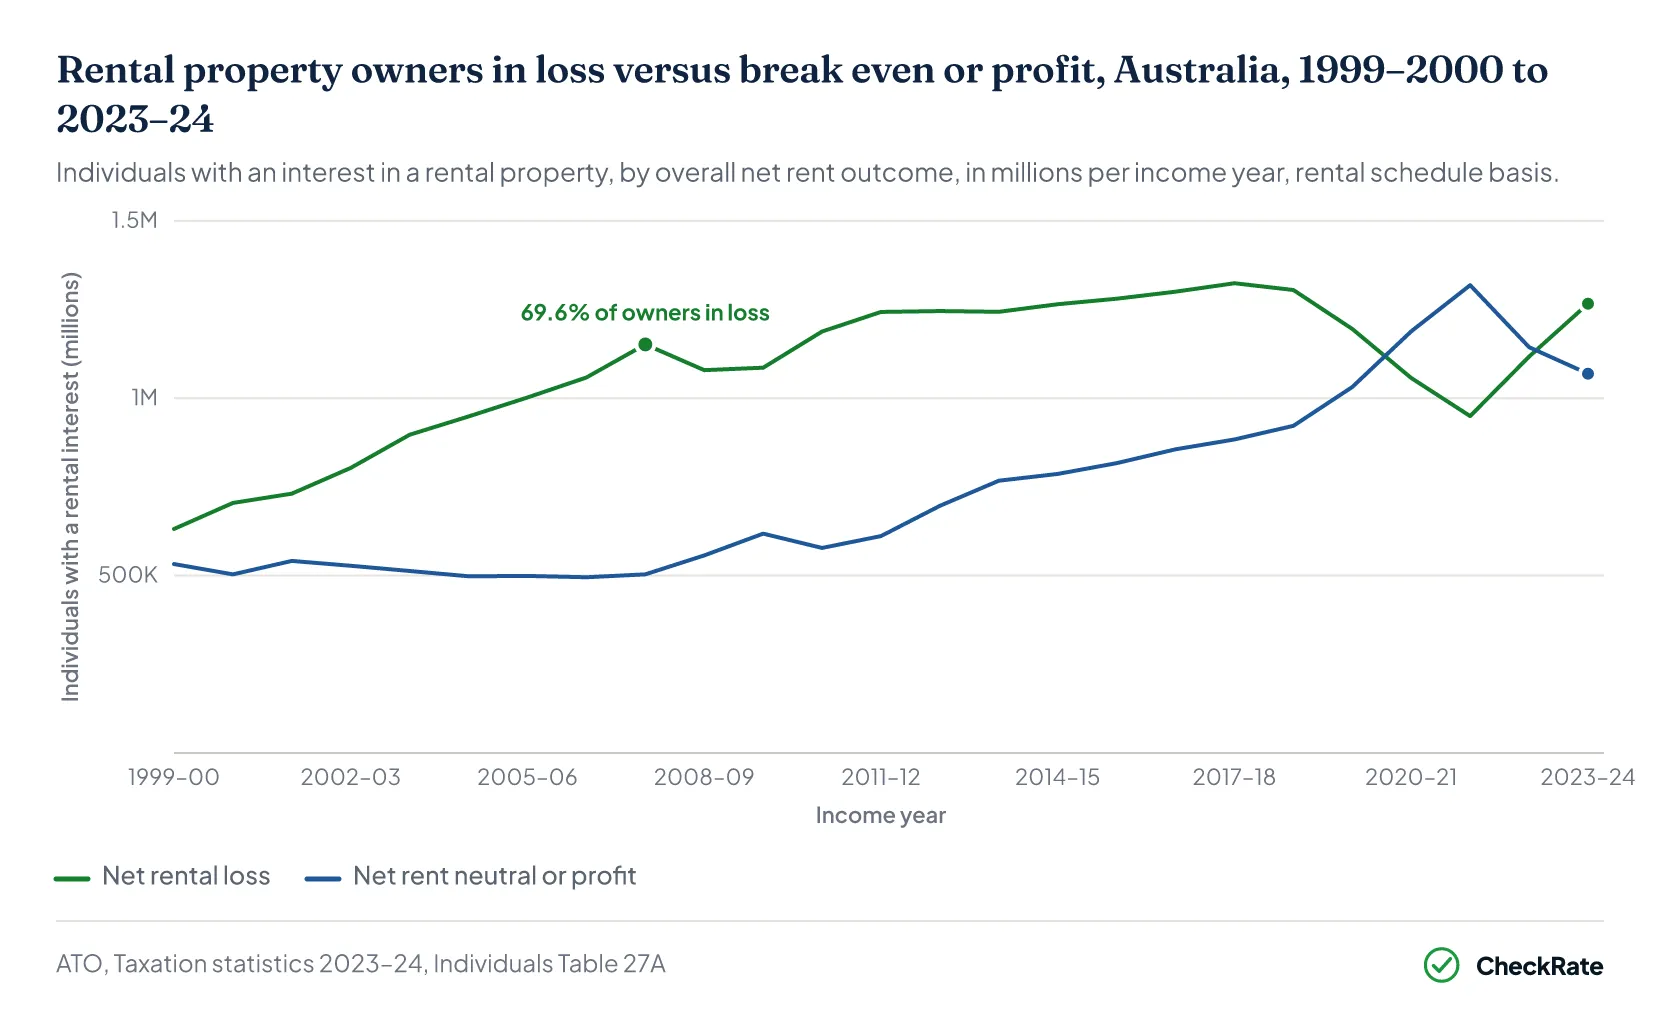
Ownership of a rental interest reached its highest count in the 25 years of published data. The count roughly doubled from 1,163,907 in 1999–2000 to 2,335,540 in 2023–24, and it fell in only three of those years. It fell by 7,081 in 2022–23, then rose by 74,460 in 2023–242. Most owners held a single property interest. A derived 71.6 per cent of the 2,335,540, 1,672,616 people, held an interest in one rental property, and a further 18.8 per cent held interests in two1.
Section 02 · In loss
How many rental property owners report a net loss?
A rental property investor is negatively geared when the property's deductions exceed the rent it earns, producing a net rental loss. Treasury's tax expenditure statement uses the same measure and describes people whose rental deductions left them with "a rental loss, known as negative gearing"3. Under the settings in place for 2023–24, that loss can generally be deducted from the investor's other income, such as salary and wages, which reduces the tax they pay. In 2023–24, 54.2 per cent of people with a rental interest, 1,266,454 of the 2,335,540, reported an overall net rental loss, a derived share. Measured against everyone who lodged a return, 7.6 per cent were negatively geared2.
The loss-making share peaked at a derived 69.6 per cent of rental owners in 2007–08 and fell to a series low of 41.9 per cent in 2021–22. It then climbed, from 49.4 per cent in 2022–23 to 54.2 per cent in 2023–24, the highest share since 2018–192. The count of loss-makers rose by 149,279 in a year, from 1,117,175 in 2022–23 to 1,266,454 in 2023–24. For three years, 2020–21 to 2022–23, the break-even-or-profit group outnumbered loss-makers, the only such years in the series. The 2023–24 loss count also remained below the series peak of 1,324,123 in 2017–18.
Most of the people in loss held a single property interest. Of the 1,266,454 people in loss in 2023–24, 914,882, a derived 72.2 per cent, held an interest in a single rental property1. The derived share of each group in loss fell as the number of interests rose, from 54.7 per cent of single-property owners to 44.9 per cent of those with six or more interests.
| Rental property owners by number of property interests and net rent outcome, Australia, 2023–24 | ||||
|---|---|---|---|---|
| Property interests | Net rental loss | Break even or profit | Total | Share in loss |
| 1 | 914,882 | 757,734 | 1,672,616 | 54.7% |
| 2 | 238,973 | 199,933 | 438,906 | 54.4% |
| 3 | 70,355 | 64,972 | 135,327 | 52.0% |
| 4 | 23,723 | 24,967 | 48,690 | 48.7% |
| 5 | 9,476 | 10,373 | 19,849 | 47.7% |
| 6 or more | 9,045 | 11,107 | 20,152 | 44.9% |
| Total | 1,266,454 | 1,069,086 | 2,335,540 | 54.2% |
Source · ATO, Taxation statistics 2023–24, Individuals statistics, Table 8
Section 03 · Income and losses
What was the total value of rental income and rental losses?
Net rental losses totalled $15.2 billion in 2023–24 on the rental schedule basis, against $12.5 billion of net rent reported by the break-even-or-profit group. The loss-making group's losses exceeded the break-even-or-profit group's net rent by a derived $2.7 billion2. The average loss was $12,014 per loss-making individual, derived by dividing the exact loss total by the 1,266,454 people in loss. On the tax return label basis, which covers everyone with a net rent result, the median outcome in 2023–24 was a loss of $934 and the average a loss of $1,1481. In 2022–23, the median was a profit of $52.
Rental income grew, but deductions grew faster. Gross rental income rose from $56.1 billion in 2022–23 to $62.2 billion in 2023–24, while total deductions, a derived sum of the three published categories, rose from $54.5 billion to $64.9 billion. Net rental income across all individuals with a net rent label fell from $1.6 billion in 2022–23 to a loss of $2.7 billion in 2023–24, the first aggregate net rental loss since 2019–204.
| Individuals' rental income and deductions, Australia, 2019–20 to 2023–24 | |||||
|---|---|---|---|---|---|
| $ billion | 2019–20 | 2020–21 | 2021–22 | 2022–23 | 2023–24 |
| Gross rental income | 48.8 | 48.9 | 50.4 | 56.1 | 62.2 |
| Rental interest deductions | 21.5 | 17.9 | 15.9 | 24.0 | 32.2 |
| Capital works deductions | 4.3 | 4.4 | 4.4 | 4.6 | 4.8 |
| Other rental deductions | 23.2 | 23.4 | 24.1 | 25.9 | 27.9 |
| Total deductions (derived) | 49.0 | 45.7 | 44.4 | 54.5 | 64.9 |
| Net rental income | −0.2 | 3.2 | 6.0 | 1.6 | −2.7 |
Source · ATO, Taxation statistics 2023–24, Snapshot Table 5, Chart 10 data
Section 04 · By income
Negative gearing by taxable income range
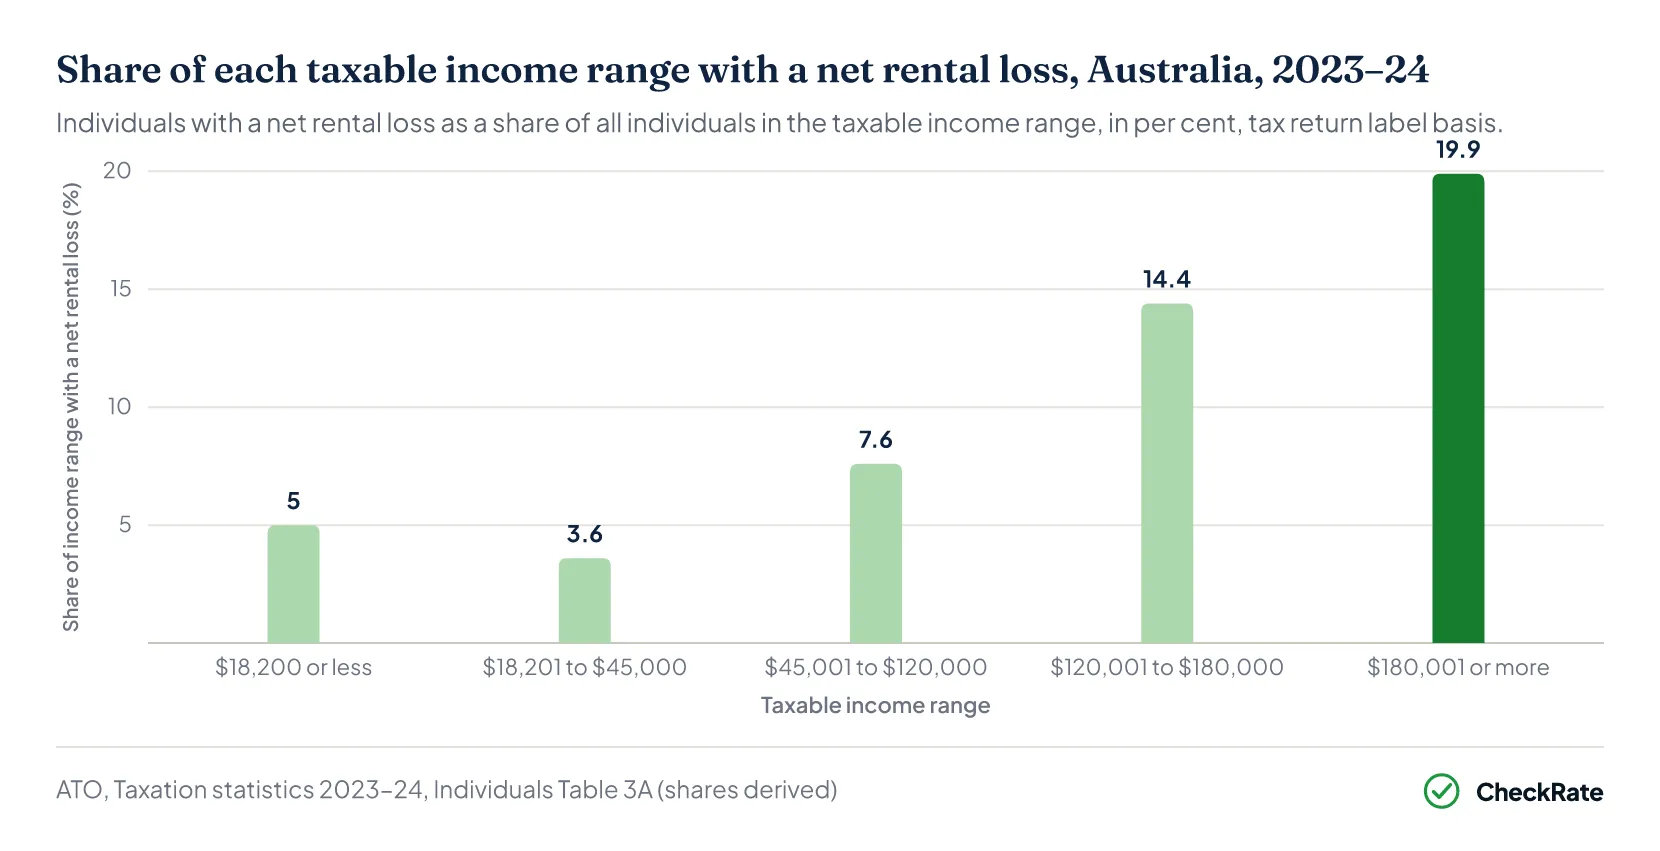
Negative gearing was most common at the top of the income distribution in 2023–24. Among people with taxable incomes of $180,001 or more, a derived 19.9 per cent reported a net rental loss, against 7.6 per cent of the $45,001 to $120,000 range and 3.6 per cent of the $18,201 to $45,000 range5. By headcount, the $45,001 to $120,000 range held the most loss-makers, 563,889 people, a derived 44.2 per cent of the 1,276,669 in loss on the return label basis. The average loss was largest in the top range, at a derived $18,054, and the lowest range averaged $13,732, above the $10,088 to $11,697 of the three middle ranges.
Taxable income in these tables is measured after the rental loss is deducted, so the loss itself pushes some higher earners into lower ranges. Treasury makes the same point about the lowest decile in its distributional analysis, stating that those tax filers "tend to have higher incomes before deductions" and that their rental claims "substantially reduce their taxable income"3. Treasury's distributional analysis for 2022–23 found the benefit concentrated at the top. Individuals in the top 30 per cent of taxable income accrued 71 per cent of the total benefit from rental losses. Across all rental deductions, 78 per cent of the tax reduction went to people with above-median income, and 37 per cent went to the top taxable income decile.
| Net rental losses by taxable income range, Australia, 2023–24 | |||||
|---|---|---|---|---|---|
| Taxable income range | People with a net rental loss | Share of loss-makers | Total losses ($m) | Average loss | Share of income range |
| $18,200 or less | 119,542 | 9.4% | 1,642 | $13,732 | 5.0% |
| $18,201 to $45,000 | 141,937 | 11.1% | 1,473 | $10,375 | 3.6% |
| $45,001 to $120,000 | 563,889 | 44.2% | 5,688 | $10,088 | 7.6% |
| $120,001 to $180,000 | 252,582 | 19.8% | 2,955 | $11,697 | 14.4% |
| $180,001 or more | 198,719 | 15.6% | 3,588 | $18,054 | 19.9% |
| All ranges | 1,276,669 | 100% | 15,345 | $12,019 | 7.7% |
Source · ATO, Taxation statistics 2023–24, Individuals Table 3A
Section 05 · Deductions
Which rental deductions account for the largest amounts?
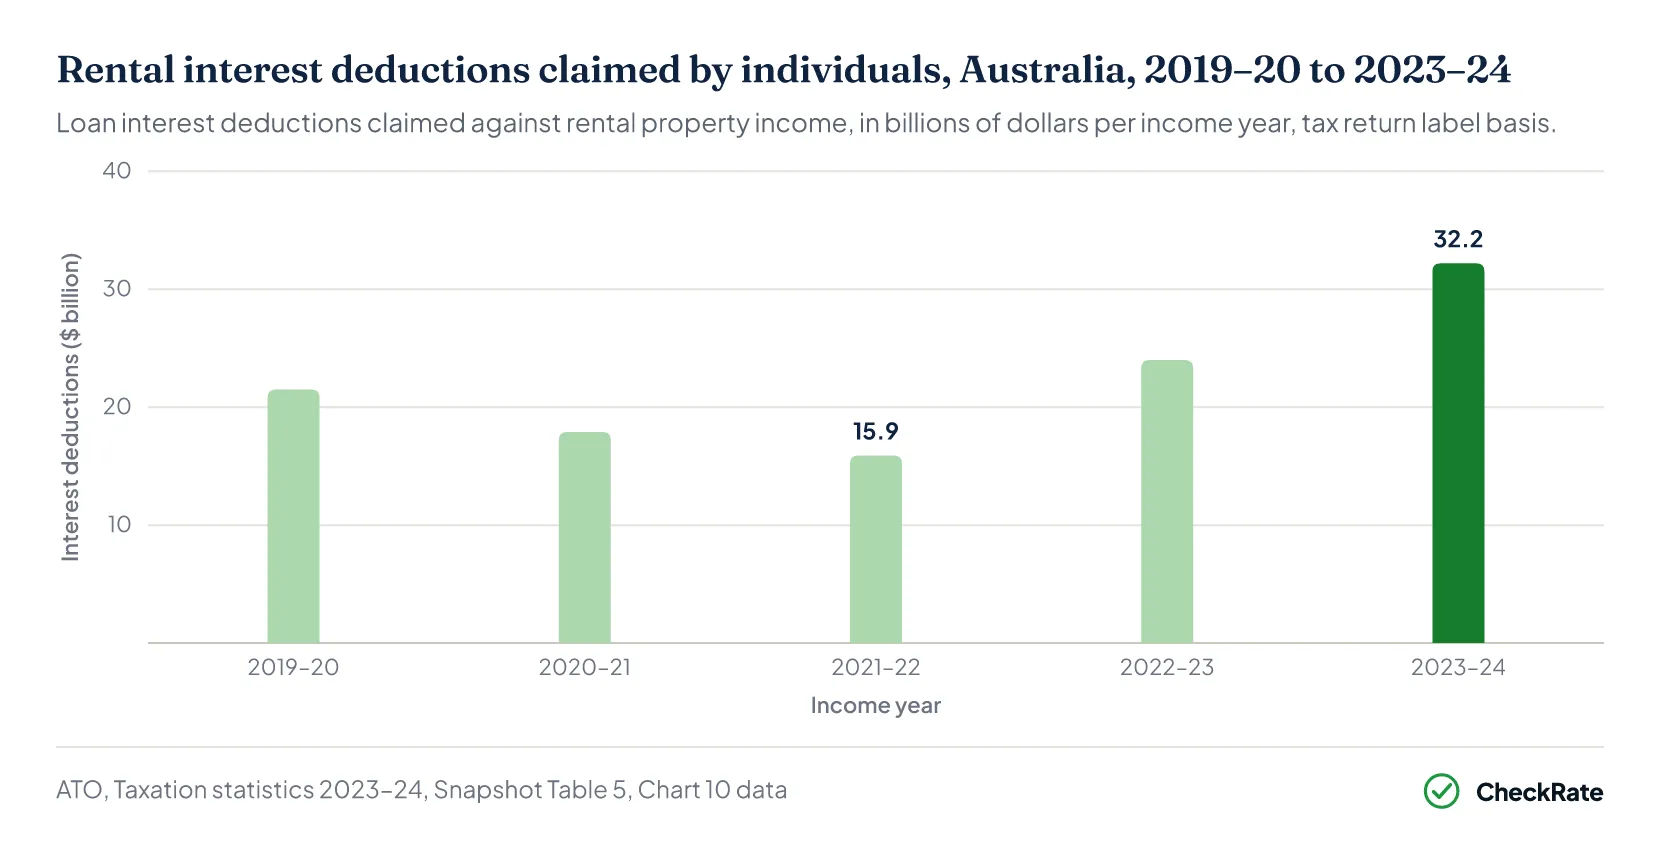
Rental deductions fall into three published categories: loan interest, capital works and other rental deductions. Capital works deductions cover construction costs claimed over decades, and the other category covers costs such as council rates, maintenance, insurance and property management fees. Interest deductions reached $32.2 billion in 2023–24, the only year of the five published in which interest was the largest of the three categories. In each year from 2019–20 to 2022–23, other rental deductions were larger4.
Interest accounted for most of the growth in deductions. Of the derived $10.4 billion increase in total deductions from 2022–23 to 2023–24, $8.2 billion was interest. Interest deductions roughly doubled in two years, rising from a five-year low of $15.9 billion in 2021–22 to $24.0 billion in 2022–23 and $32.2 billion in 2023–24, a derived increase of 103 per cent4. For 2022–23, the first year of that rise, Treasury states that the growth "predominantly reflects the increases to interest rates in the year", with interest climbing from a 36 per cent share of its measure of total rental deductions in 2021–22 to 44 per cent in 2022–233. Capital works deductions moved little, rising from $4.3 billion in 2019–20 to $4.8 billion in 2023–24.
Section 06 · Budget cost
What does negative gearing cost in forgone revenue?
There is no published cash cost of negative gearing; what Treasury publishes is an estimate. According to the 2025–26 Tax Expenditures and Insights Statement, around 2.4 million people claimed $57.1 billion of rental deductions incurred in earning $59.0 billion of gross rental income in 2022–23. Of those people, 49 per cent, 1.2 million, had a rental loss totalling $11.0 billion. Those rental losses provided an estimated tax benefit of around $3.9 billion3. The estimate recalculates 2022–23 tax with the deductions excluded, assuming taxpayer behaviour would not change. It is not a measured cash cost, and not an estimate of what changing the rules would raise. The aggregates are computed under Treasury's methodology and differ from the ATO label totals earlier on this page; each figure is quoted on its source's basis.
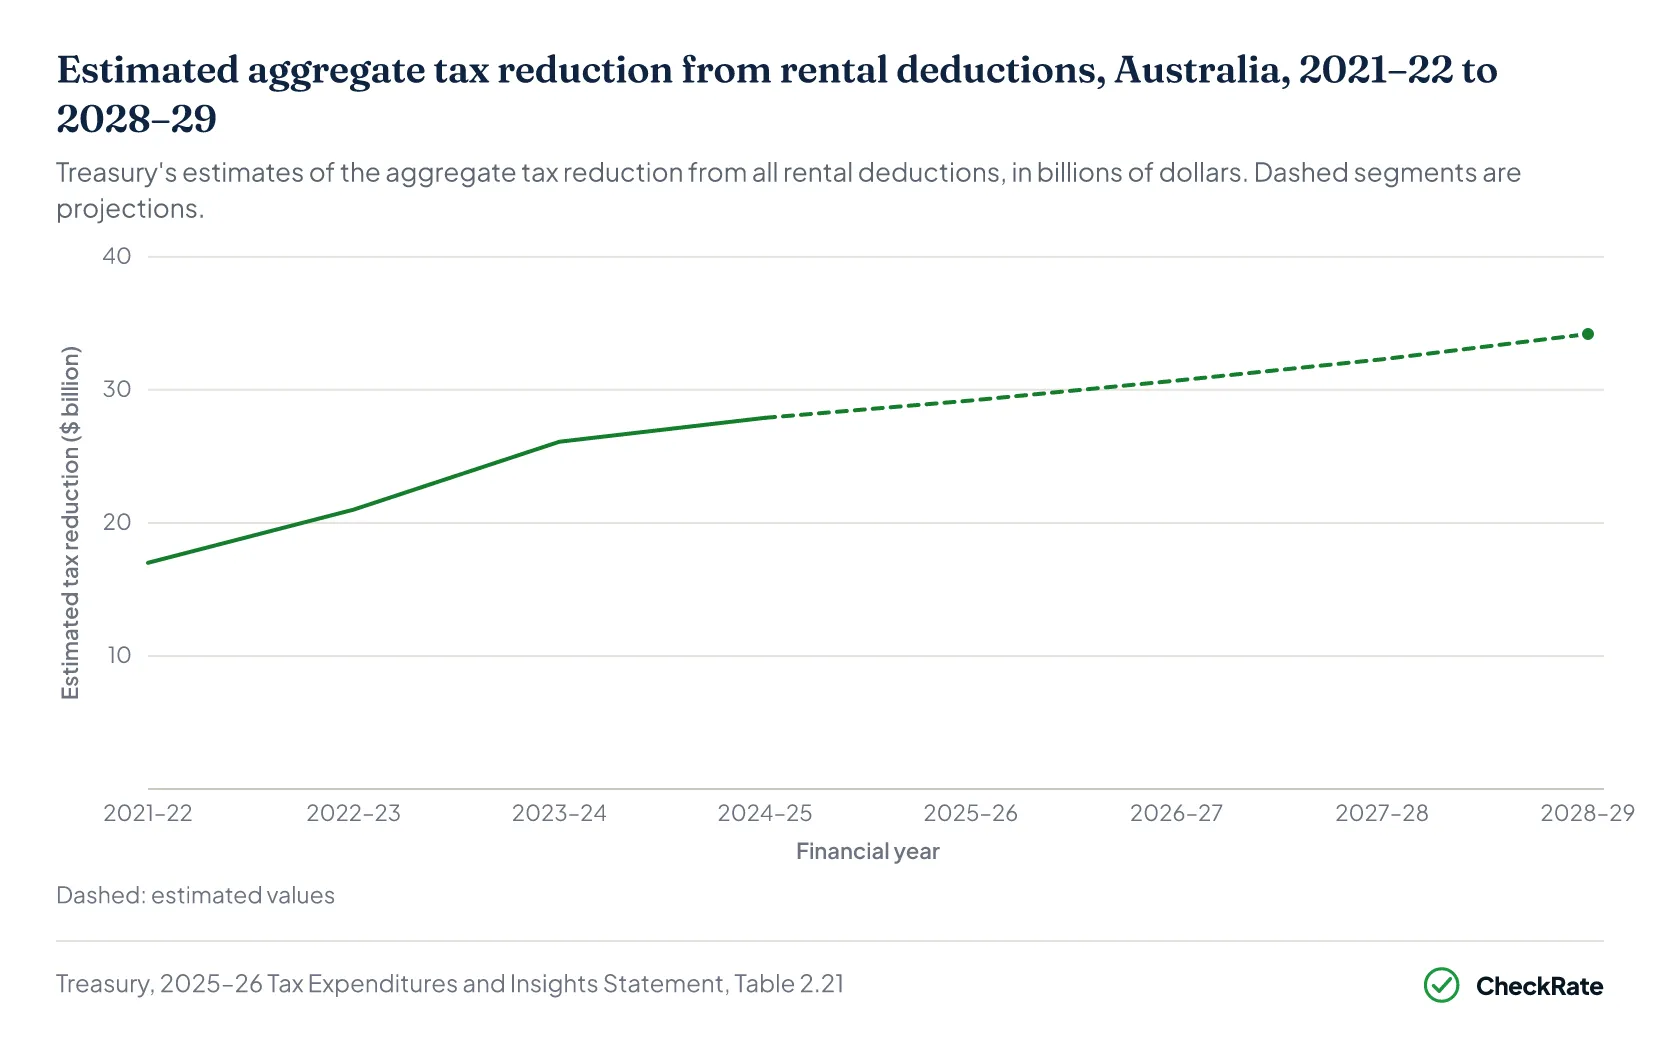
The $3.9 billion is a component of a larger estimate covering the tax reduction from all rental deductions. Treasury estimated the total tax reduction from rental deductions at $21.0 billion for 2022–23, rising from $17.0 billion in 2021–22, and projected it to reach $34.2 billion by 2028–293. Those projections were published on 17 December 2025 and reflect the law before the 2026 reform passed. In the statement's table of large tax expenditures and deductions for 2025–26, rental deductions appear at an estimated $29.2 billion as one of three personal deduction categories rather than a coded tax expenditure.
How rental deductions compare with the other large deduction and concession categories is covered in the overview of how the Australian tax system works.
Section 07 · From July 2027
How does the new-build restriction change negative gearing from 1 July 2027?
From 1 July 2027, negative gearing for newly purchased residential property is limited to new builds. Rental losses on established residential investment properties purchased after 7:30pm AEST on 12 May 2026 can no longer be deducted against salary and other income. They become deductible only against income from residential property, including capital gains on residential property, and any excess carries forward to future years6. A property purchased between the announcement and 30 June 2027 can be negatively geared during that period, but not from 1 July 2027.
The change was announced on 12 May 2026 as part of the 2026–27 Budget. The Treasury Laws Amendment (Tax Reform No. 1) Bill 2026 passed both Houses of Parliament on 25 June 2026 and received royal assent on 26 June 2026 as Act No. 49 of 20267. Schedule 2 of the Act inserts the restriction into the Income Tax Assessment Act 1997 and applies to the 2027–28 and later income years. The ATO confirms the measures are now law8.
Several groups keep the existing rules. Properties held at the announcement, including where a contract had been entered into but not settled, can be negatively geared until sold. New builds, defined in the factsheet as residential properties that genuinely add to supply, can still be negatively geared. That definition covers dwellings constructed on vacant land and demolitions replaced with a greater number of dwellings, while knock-down rebuilds and renovations that do not increase supply are not eligible6. The new-build eligibility generally attaches to the first purchase. A new build cannot have been previously sold, unless it was first owned by the builder and occupied for no more than 12 months. Subsequent purchasers of the dwelling can access neither negative gearing nor the 50 per cent CGT discount for that property. The changes apply to individuals, partnerships, companies and trusts other than widely held trusts, and superannuation funds are excluded. Commercial property and other asset classes such as shares keep the existing arrangements. Targeted exemptions apply for investors supporting government housing programs.
The changes mainly affect future purchases. According to the factsheet, around 1 per cent of tax filers acquired negatively geared properties each year, around 230,000 individuals in 2022–23. Treasury modelling suggests the reforms will result in around 75,000 additional owner-occupiers over the decade from the 2026 announcement. The factsheet expects rents to increase by less than $2 per week for a household paying the median rent as at the May 2026 Budget, and house prices to grow around 2 per cent less over about two years than they would have without the change6. The same Act replaces the 50 per cent CGT discount for individuals, trusts and partnerships with cost base indexation and a 30 per cent minimum tax rate on capital gains from 1 July 2027.
The mechanics of that change are covered in the comparison of the CGT discount and indexation.
Held at 7:30pm AEST, 12 May 2026
Existing rules until the property is sold
Losses deductible against salary and other income
Includes contracts entered into but not settled
New build, first eligible purchase
Negative gearing remains available from 1 July 2027
Must genuinely add to housing supply
Generally cannot have been previously sold
Established, bought after the announcement
From 1 July 2027, losses quarantined to residential property income
Excess losses carry forward
Later buyers of a new build are also in this group
Source · Budget 2026–27 factsheet: grandfathering arrangements, new-build definition and reform design
Section 08 · FAQ
Negative gearing statistics: quick answers
What does negatively geared mean?
A rental property investor is negatively geared when the deductions on the property, such as loan interest, council rates, maintenance and capital works, exceed the rent it earns, producing a net rental loss. Under the tax settings in place for 2023–24, that loss can generally be deducted from the investor's other income, such as salary and wages, which reduces the tax they pay.
How many Australians negatively gear?
1,266,454 people reported an overall net rental loss in 2023–24, which was 54.2 per cent of the 2,335,540 people with an interest in a rental property and 7.6 per cent of the 16,584,287 who lodged an individual tax return, with shares derived from the ATO's Taxation statistics 2023–24. The count of loss-makers rose by 149,279 on 2022–23.
What is the average negative gearing loss?
The average net rental loss was $12,014 per loss-making individual in 2023–24, derived by dividing the $15,215 million of net rental losses by the 1,266,454 people in loss in ATO Taxation statistics 2023–24. On the tax return label basis, the average was highest for people with taxable incomes of $180,001 or more, at $18,054, and the range from $45,001 to $120,000 averaged $10,088.
Do most negatively geared investors own multiple properties?
No. Of the 1,266,454 people with a net rental loss in 2023–24, 914,882, a derived 72.2 per cent, held an interest in one rental property, and a further 238,973, or 18.9 per cent, held interests in two, according to ATO Taxation statistics 2023–24.
How much does negative gearing cost the government?
Treasury estimated that rental losses provided a tax benefit of around $3.9 billion in 2022–23, within an estimated $21.0 billion tax reduction from all rental deductions that year. The estimate recalculates tax with the deductions excluded, assuming taxpayer behaviour would not change. It is not a measured cash cost, and not an estimate of what changing the rules would raise.
Is negative gearing being abolished?
No. Under the Treasury Laws Amendment (Tax Reform No. 1) Act 2026, rental losses on established residential investment properties purchased after 7:30pm AEST on 12 May 2026 can only be deducted against income from residential property from 1 July 2027, with any excess carried forward. Properties held at the announcement can still be negatively geared until sold, and an eligible first purchase of a new build can still be negatively geared. Later buyers of that same property are not eligible.
References
- ATO, Taxation statistics 2023–24, Individuals statistics (QC107510) · ato.gov.au ↑ b c d
- ATO, Taxation statistics 2023–24, Individuals Table 27 (XLSX via data.gov.au) · data.gov.au ↑ b c d
- Treasury, 2025–26 Tax Expenditures and Insights Statement · treasury.gov.au ↑ b c d e
- ATO, Taxation statistics 2023–24, Snapshot chart data · data.gov.au ↑ b c
- ATO, Taxation statistics 2023–24: Individuals Table 3 (Table 3A) · data.gov.au ↑
- Australian Government, Budget 2026–27 factsheet: Negative Gearing and Capital Gains Tax Reform · budget.gov.au ↑ b c
- Parliament of Australia, Treasury Laws Amendment (Tax Reform No. 1) Bill 2026 homepage · aph.gov.au ↑
- ATO, Tax reform – Boosting home ownership – Reforming negative gearing and capital gains tax (QC 107304) · ato.gov.au ↑
- Australian Government, Budget 2026–27, Budget Paper No. 2, Receipt Measures · budget.gov.au
- Treasury Laws Amendment (Tax Reform No. 1) Act 2026 (Cth), No. 49 of 2026 · legislation.gov.au