

Updated
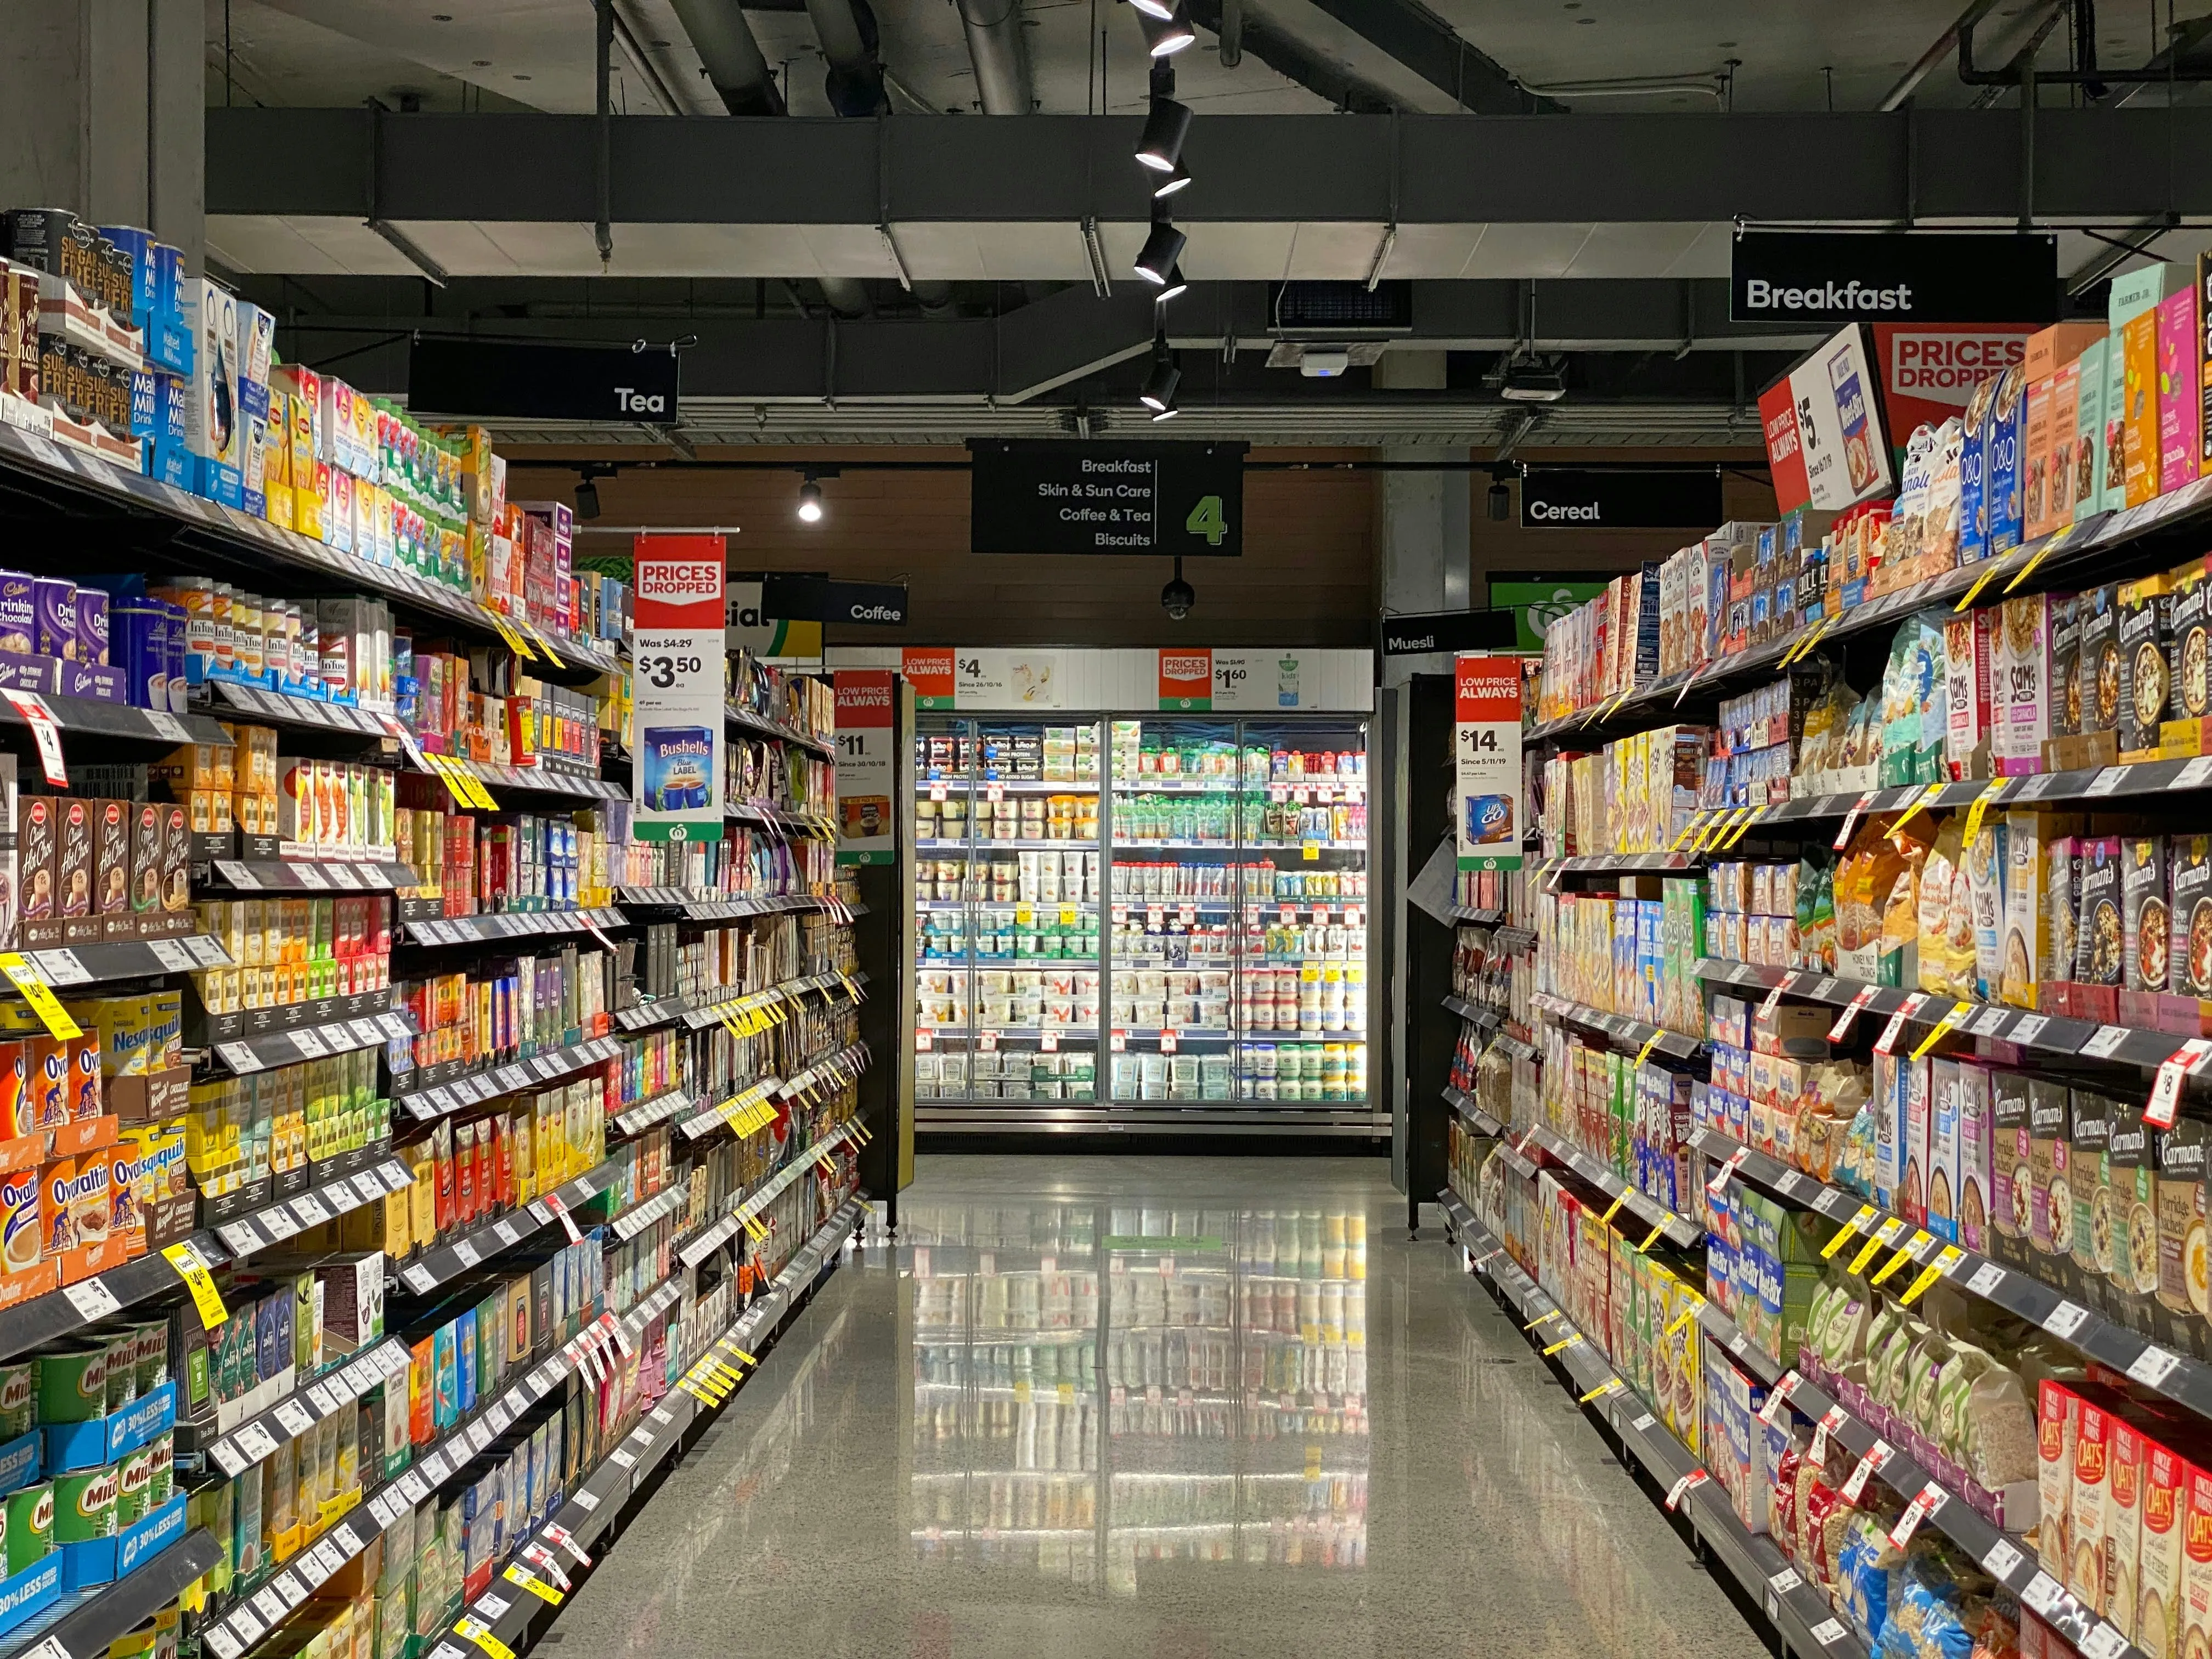
Spending is one of the clearest ways to see how households are feeling.
When households feel confident, money tends to move more freely. People book trips, eat out, buy clothes or take on home projects. Not always extravagantly, but with a bit more ease.
When budgets feel tight, those decisions shift. The restaurant becomes a home-cooked meal. The holiday gets pushed back. The cheaper brand goes into the trolley. Bigger purchases wait.
That is why household spending matters. It shows how Australians are responding to interest rates, prices, wages and job security in real time. For the Reserve Bank of Australia (RBA), those choices help show whether demand is still strong, starting to cool, or shifting back towards the essentials.
- Monthly change
- 0.0%
- Change in household spending from July to August 2026, ABS
- Annual growth
- 6.8%
- Rise in household spending in the year to August 2026, ABS
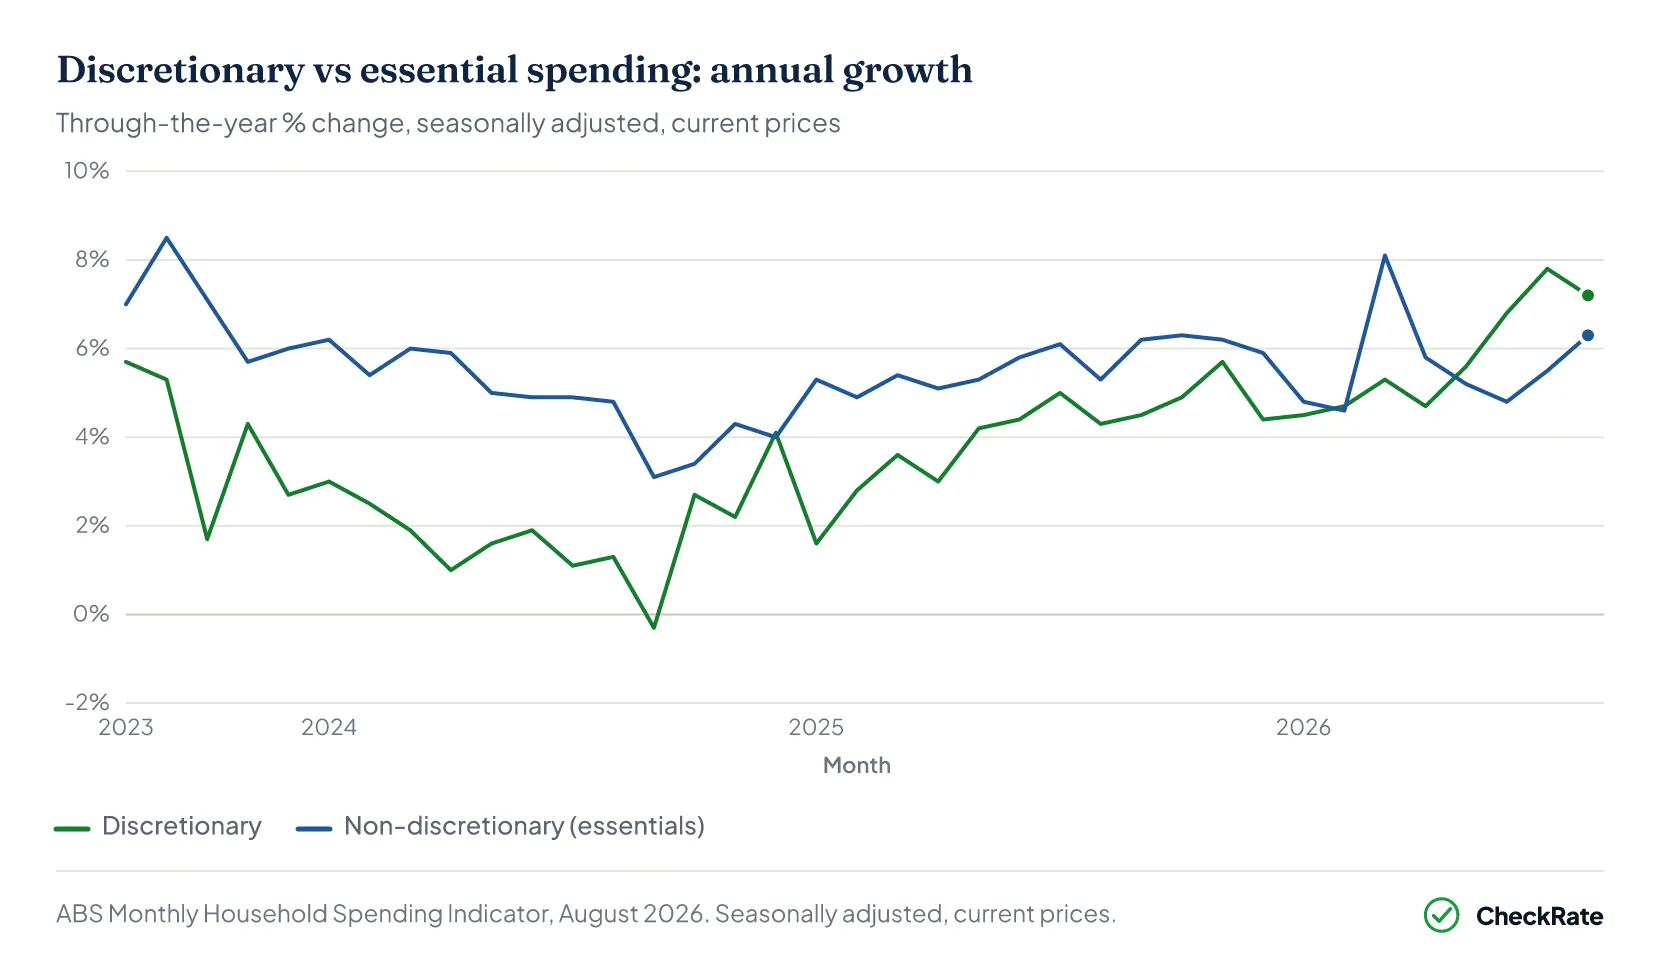
- Discretionary spending
- 7.2%
- Annual growth in extras such as eating out, travel and clothing, August 2026
- Essential spending
- 6.3%
- Annual growth in essentials such as groceries, fuel and bills, August 2026
 Cost of living in Australia: what households spent in 2025Australian households spent a combined $923 billion across tracked consumer categories in 2025, up 52% from $606 billion in 2016. When housing costs are included, the average household is estimated to…
 How much debt do Australian households have?As of December 2025, Australian households owe a combined $3.40 trillion, up from $2.06 trillion ten years earlier. That means household debt has grown by 65% in a decade, adding around $1.34 trillion…
 Australian Savings Statistics 2025Australia's saving rate shifted over the past decade. Before the pandemic, it sat between 4.5% and 7.4%. When COVID lockdowns limited people's spending, savings increased. By FY2021, the saving rate h…
Section 01 · First cuts
Where households cut back first
Household spending helps show how money is moving through the economy. Every purchase forms part of a bigger picture, from groceries, fuel and insurance to restaurants, travel, clothing and home upgrades.
One of the clearest shifts during periods of financial pressure is the difference between essential and discretionary spending. Essentials are the things households usually keep paying for, such as housing, groceries, electricity, healthcare, transport and education. Discretionary spending is more flexible and includes things like holidays, entertainment, fashion, homewares and upgrades.
When budgets tighten, spending usually changes shape rather than stopping altogether. A family may still buy groceries but reach for cheaper brands. They may still want to travel, but shorten the trip or push it to next year.
These changes matter because they can spread through the economy. Strong spending can support business sales, hiring and investment. Softer discretionary spending can make businesses more cautious, reduce stock orders, delay hiring or offer discounts. For the RBA, these patterns help show how households are responding to inflation, interest rates, wages and broader cost-of-living pressure.
Section 02 · Confidence signals
Spending habits reveal household confidence
The way households spend can say a lot about how secure they feel financially.
Two households with similar incomes can make very different choices. One keeps eating out, booking trips and buying household items because work feels stable and the bills feel manageable. The other starts cutting back because rent is rising, mortgage repayments feel heavier, or the months ahead are harder to read.
That caution often appears before income changes. People may delay bigger purchases, choose cheaper options or reduce nice-to-have spending simply because they feel less certain about what is coming next.
Consumer confidence matters because it can shape demand across the economy. When households spend less, businesses feel it through sales, stock levels, staffing plans and pricing decisions.
Section 03 · Rate pass-through
How rate changes reach household budgets
Interest rate decisions do not stay in the financial pages for long. They eventually show up in household budgets, but not in the same way for everyone.
For people with variable-rate mortgages or other debt, higher interest costs can mean less money left over for groceries, bills, or bigger purchases. For savers, higher deposit rates may improve interest income. For renters, the link can be less direct, but rent, investor costs and housing market conditions can still shape what they feel month to month.
A mortgage holder, a renter, a retiree and a young family can all experience the same cash rate decision very differently.
Household spending helps pull those different experiences into one broader picture. It shows whether Australians are still spending, starting to cut back, or shifting money away from extras and towards essentials.
Section 04 · Ahead of the data
The budget shifts before the statistics do
Official spending data can take time to show what households already know.
People often feel the change first in small, unremarkable decisions. The grocery shop gets pared back. Saturday night out becomes a monthly event rather than a weekly one. The school shoes are bought, but the new jacket waits.
Those choices matter because they show how households are responding before the national figures catch up. Data can confirm the trend later, but the early signs often appear in the way people spend, delay, swap or go without.
That lived experience helps give context to the numbers. Spending data shows what is happening across the economy, but household behaviour can reveal how quickly financial pressure is being felt.
Section 05 · Flow-on effects
Businesses feel it when households change course
Household spending does not stop at the family budget. It flows straight into businesses.
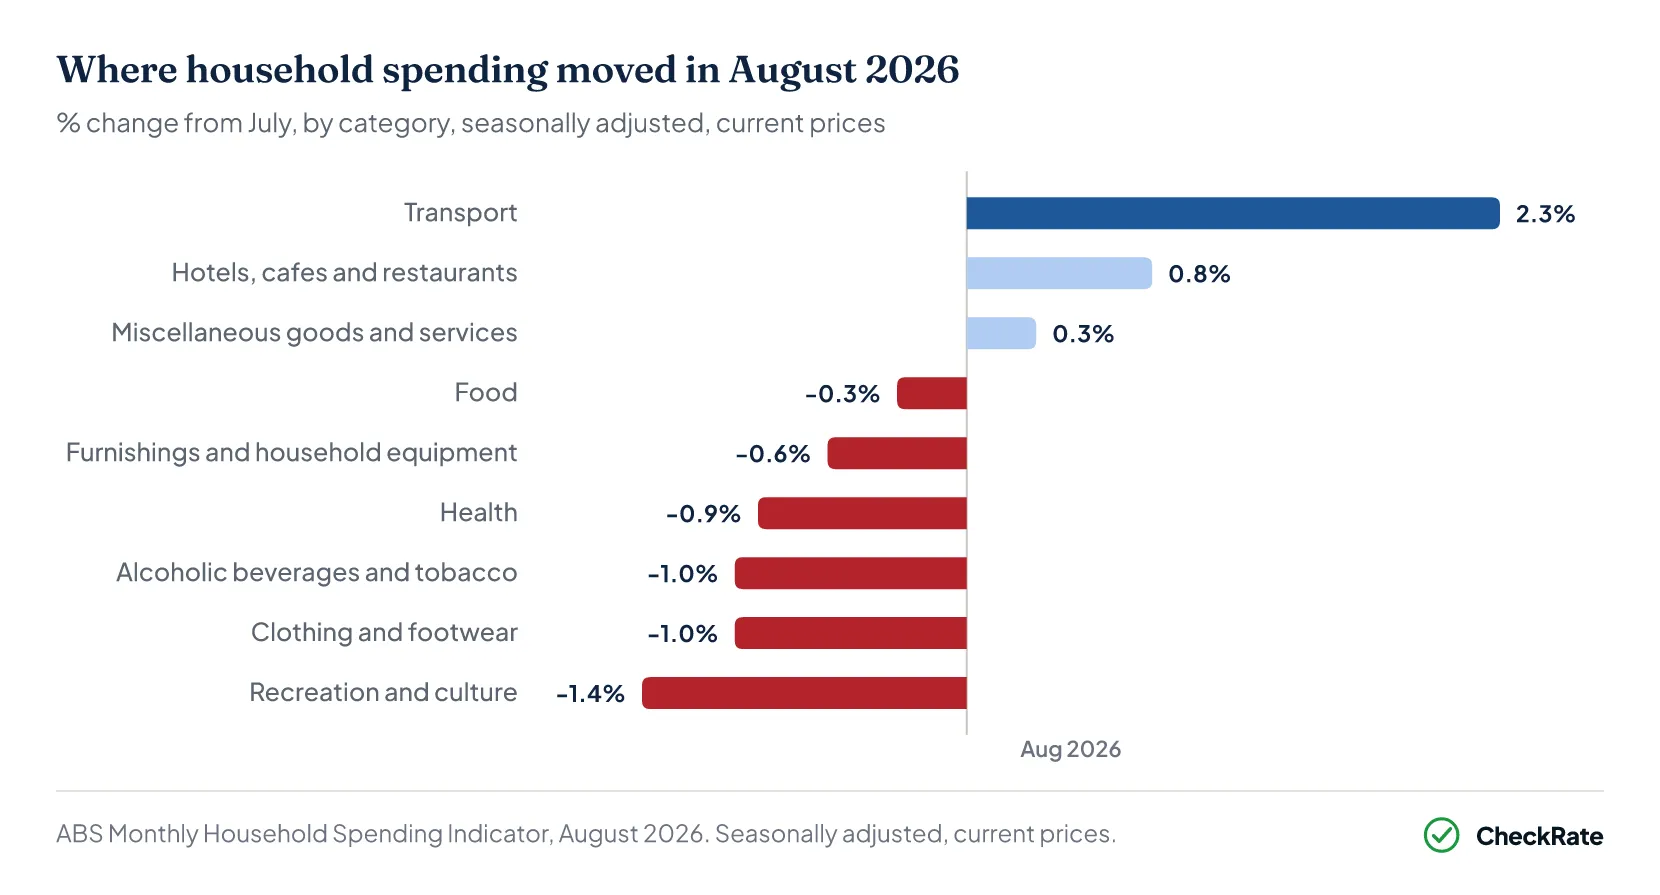
Retailers notice when shoppers wait for sales instead of paying full price. Cafes see when regulars come in less often. Travel operators watch whether people are still planning holidays, while builders and trades can often tell when households are delaying renovations or repairs.
Those small signals can shape bigger business decisions. If customers become more cautious, businesses may reduce stock orders, hold off on hiring, offer discounts or delay expansion plans. If spending strengthens, they may hire, invest or increase output.
For the RBA, these patterns help show whether demand is building, easing or simply changing shape across the economy.
Section 06 · Reading the numbers
Why household spending is not always straightforward
Spending data can look simple at first glance, but it often needs a closer read.
If households spend more, it does not always mean they are buying more. Sometimes it simply means prices have gone up. A family may spend more at the supermarket and still come home with the same amount of food, or less.
That difference matters. Higher spending because prices are rising tells a very different story from higher spending because people feel confident enough to buy more.
Other factors can shift the numbers too: population growth, seasonal events, tax changes, government support, fuel prices, rent increases and one-off disruptions can all leave a mark.
The detail matters more than the headline number. A rise in spending can sometimes reflect confidence and stronger demand, while other times it may simply show households paying more for the same everyday essentials.
Section 07 · The takeaway
The bottom line on household spending
No single data point tells the full story, but household spending comes close. It connects the decisions made around kitchen tables and in supermarket aisles to the broader forces shaping the economy: interest rates, inflation, wages, job security and confidence.
For anyone watching RBA decision dates, it is one of the more useful places to look. Not because the numbers are always straightforward, but because they reflect something real: how Australians are managing their money.
References
- ABS Monthly Household Spending Indicator — household spending, Australia · Australian Bureau of Statistics ↑ b c