

Published
Section 01 · June quarter 2026
How much plant and equipment finance was committed in the June quarter 2026?
Small businesses committed to $5.54 billion of new fixed-term loans for plant and equipment in the June quarter 2026, according to the Australian Bureau of Statistics (ABS) Lending Indicators1. Medium businesses committed to $1.93 billion of new fixed-term loans for plant and equipment. Businesses of all sizes committed to $3.40 billion of new finance leases in original terms, of which $3.08 billion was for the purchase of plant and equipment. Together, these three ABS measures totalled $10.56 billion: small-business loans, medium-business loans and finance leases for plant and equipment.
Small-business plant and equipment commitments rose 21.9%, from $4.55 billion in the March quarter 2026 to $5.54 billion in the June quarter 2026, but were 6.9% lower than $5.95 billion in the June quarter 20251. Medium-business plant and equipment commitments fell 5.5%, from $2.04 billion in the March quarter 2026 to $1.93 billion in the June quarter 2026, and were 18.9% lower than $2.38 billion in the June quarter 2025.
The purpose figures are original values, not seasonally adjusted1.
The ABS counts a commitment when a lender makes a firm offer of a loan and the borrower accepts it2. Plant and equipment finance covers lending for non-property assets, including road vehicles and earthmoving plant, farm machinery and office equipment.
A small business is one where the lender's total exposure is less than $1 million and turnover is less than $50 million2. A medium business has an exposure of $1 million or more and turnover of less than $50 million, and a large business has turnover of $50 million or more.
| New loan and lease commitments for plant and equipment and for all purposes, Australia, $ million, original, June quarter 2025 to June quarter 2026 | |||||
|---|---|---|---|---|---|
| Measure | June quarter 2026 | March quarter 2026 | June quarter 2025 | Change on quarter (%) | Change on year (%) |
| Small businesses, plant and equipment finance (fixed-term loans) | 5,540.3 | 4,545.7 | 5,952.0 | +21.9 | -6.9 |
| Medium businesses, plant and equipment finance (fixed-term loans) | 1,931.4 | 2,044.1 | 2,382.9 | -5.5 | -18.9 |
| Finance leases, all purposes including refinancing | 3,403.7 | 3,332.9 | 3,373.4 | +2.1 | +0.9 |
| Finance leases, purchase of plant and equipment | 3,084.3 | 3,074.3 | 3,124.1 | +0.3 | -1.3 |
| Finance leases, purchase of road vehicles | 830.9 | 793.8 | 867.0 | +4.7 | -4.2 |
Source · ABS, Lending Indicators, Tables 28, 30 and 32
Section 02 · By purpose
What share of small and medium business lending goes to plant and equipment?
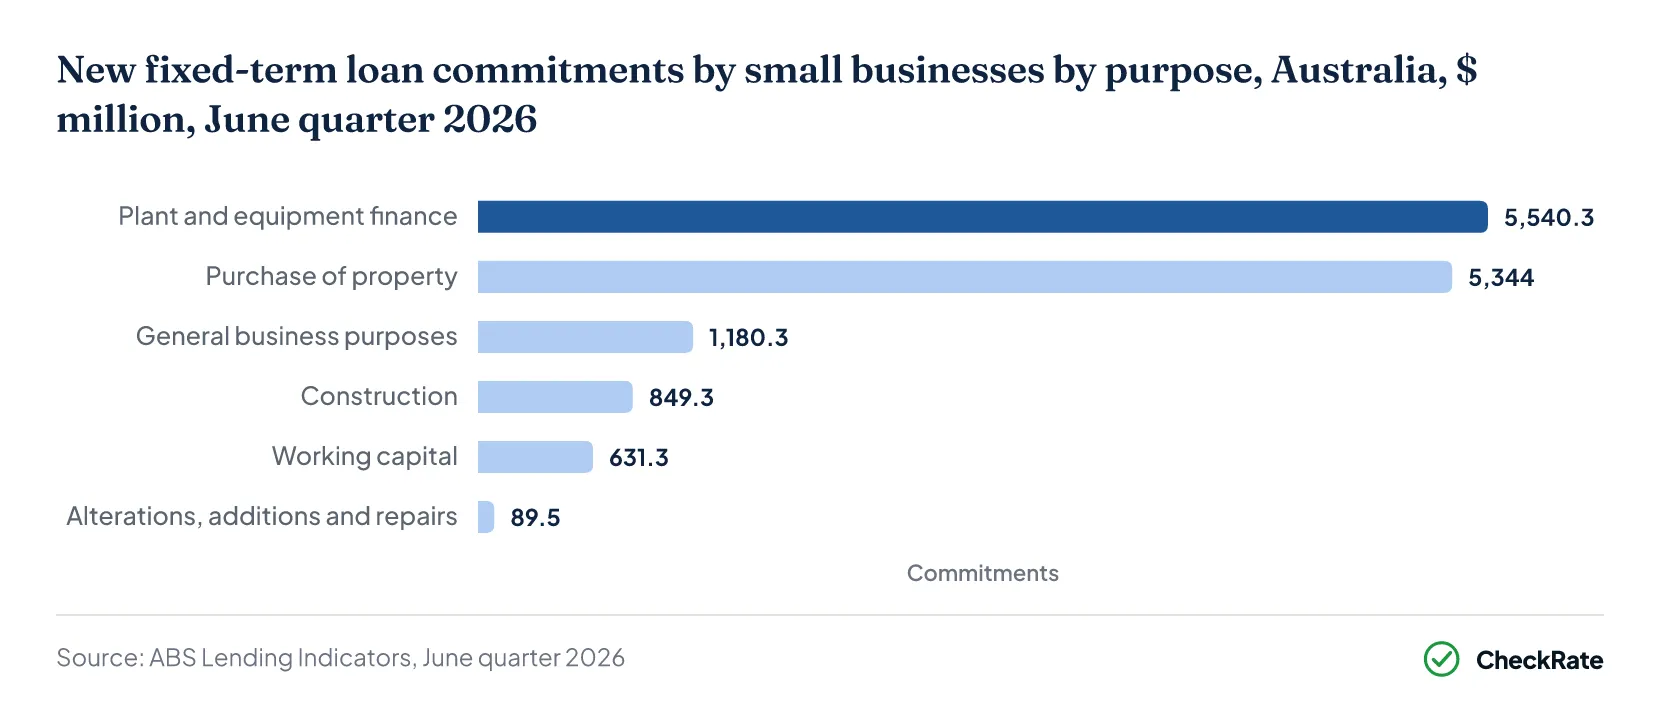
Plant and equipment finance was the largest of the six published purposes for small-business fixed-term loans in the June quarter 2026, at $5.54 billion, or 39.6% of the $14.00 billion of new fixed-term loan commitments excluding refinancing1. Purchase of property ranked second, at $5.34 billion, or 38.2%.
Purchase of property was the largest of the seven published purposes for medium-business fixed-term loans, at $14.52 billion, or 43.1% of the $33.72 billion of new fixed-term loan commitments excluding refinancing1. General business purposes ranked second, at $6.72 billion, or 19.9%. Plant and equipment finance ranked fifth among the seven purposes published for medium businesses, at $1.93 billion, or 5.7%.
The plant and equipment share of small-business commitments excluding refinancing was unchanged at 39.6% between the June quarter 2025 and the June quarter 20261. Total small-business commitments excluding refinancing fell 6.9%, from $15.03 billion in the June quarter 2025 to $14.00 billion in the June quarter 2026.
For medium businesses, the plant and equipment share fell from 7.6% in the June quarter 2025 to 5.7% in the June quarter 20261.
| New fixed-term loan commitments by purpose, small and medium businesses, Australia, $ million, original, June quarter 2026 | ||||
|---|---|---|---|---|
| Purpose | Small businesses ($ million) | Share (%) | Medium businesses ($ million) | Share (%) |
| Construction | 849.3 | 6.1 | 5,342.6 | 15.8 |
| Alterations, additions and repairs | 89.5 | 0.6 | np | np |
| Purchase of property | 5,344.0 | 38.2 | 14,523.1 | 43.1 |
| Wholesale finance | np | np | 154.0 | 0.5 |
| Plant and equipment finance | 5,540.3 | 39.6 | 1,931.4 | 5.7 |
| Working capital | 631.3 | 4.5 | 3,758.4 | 11.1 |
| Acquisitions | np | np | 1,292.6 | 3.8 |
| General business purposes | 1,180.3 | 8.4 | 6,720.2 | 19.9 |
| Total purpose excluding refinancing | 13,996.1 | 100.0 | 33,722.2 | 100.0 |
Source · ABS, Lending Indicators, Tables 30 and 32
Section 03 · Finance leases
How much equipment do businesses finance through leases?
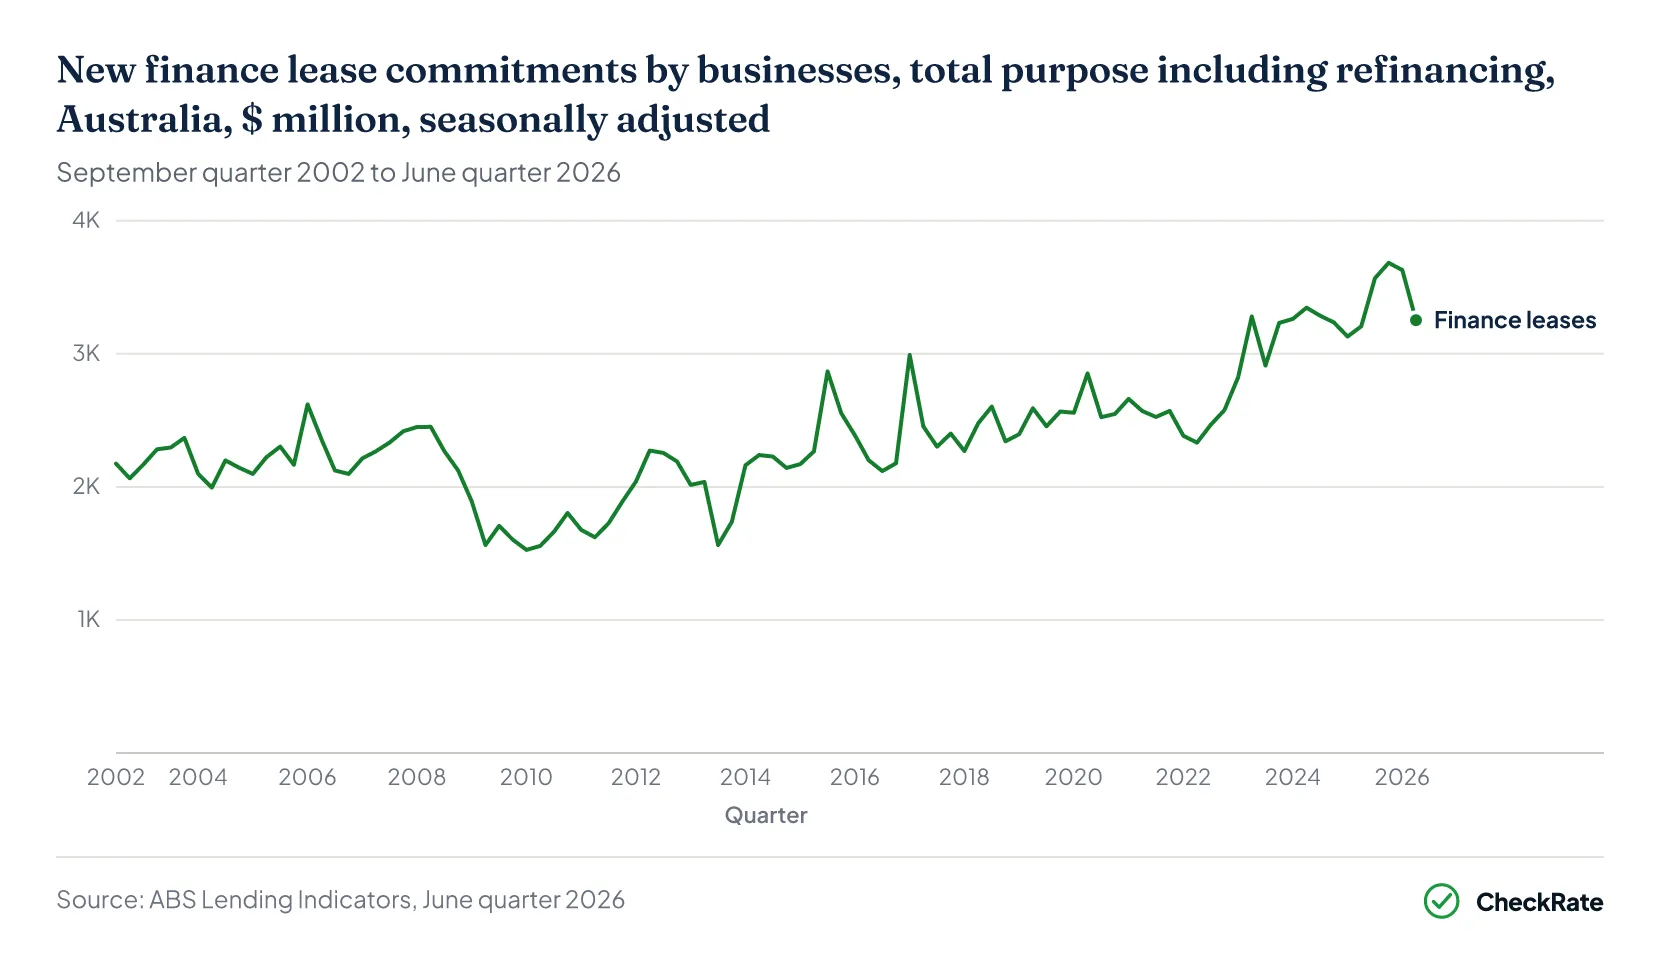
Businesses of all sizes committed to $3.40 billion of new finance leases in the June quarter 2026 in original terms, including refinancing1. Plant and equipment leases accounted for $3.08 billion, or 90.6%, of the total. Road vehicles accounted for $830.9 million, or 26.9%, of the plant and equipment leases. The ABS did not publish values for other transport equipment and other plant and equipment in the quarter.
On a seasonally adjusted basis, finance lease commitments were $3.25 billion in the June quarter 2026, down 10.4% from $3.63 billion in the March quarter 2026 and up 1.4% from $3.21 billion in the June quarter 20251.
The December quarter 2025 had the largest quarterly finance lease commitments over the period from the September quarter 2002 to the June quarter 2026, at $3.92 billion in original terms. The smallest were recorded in the March quarter 2010, at $1.41 billion1.
Over 2025-26, finance lease commitments totalled $14.11 billion, up 9.8% from $12.85 billion in 2024-251. Leases for the purchase of plant and equipment totalled $12.78 billion in 2025-26.
| New finance lease commitments by purpose, Australia, $ million, June quarter 2025 to June quarter 2026 | |||||
|---|---|---|---|---|---|
| Purpose | June quarter 2026, original | June quarter 2025, original | Change (%) | June quarter 2026, seasonally adjusted | June quarter 2026, trend |
| Total purpose including refinancing | 3,403.7 | 3,373.4 | +0.9 | 3,253.3 | 3,398.2 |
| Purchase of total plant and equipment | 3,084.3 | 3,124.1 | -1.3 | 2,943.2 | 3,068.0 |
| Purchase of road vehicles | 830.9 | 867.0 | -4.2 | 821.3 | 826.0 |
| Purchase of other transport vehicles and equipment | np | np | np | np | np |
| Purchase of other plant and equipment | np | np | np | np | np |
Source · ABS, Lending Indicators, Table 28
Section 04 · Capital expenditure
How much do businesses spend on equipment, plant and machinery?
Private businesses spent $24.9 billion on new equipment, plant and machinery in the June quarter 2026, equal to 47.0% of the $53.0 billion of total new capital expenditure3. Spending on buildings and structures was $28.1 billion.
The quarterly figures are seasonally adjusted and in current prices3.
Equipment capital expenditure fell 8.9%, from $27.3 billion in the March quarter 2026 to $24.9 billion in the June quarter 2026, and rose 14.5% from $21.7 billion in the June quarter 20253.
The March quarter 2026 had the largest quarterly equipment capital expenditure over the period from the June quarter 1987 to the June quarter 2026, at $27.3 billion3.
Over 2025-26, private businesses spent $99.9 billion on equipment, plant and machinery, up 16.0% from $86.2 billion in 2024-253. Equipment, plant and machinery accounted for 47.6% of the $210.0 billion of total capital expenditure in 2025-26.
Businesses expected to spend $84.7 billion on equipment, plant and machinery in 2026-27, at the third estimate, reported in July and August 20263.
This was 18.6% higher than the equivalent $71.4 billion estimate for 2025-26, reported a year earlier3. Total expected capital expenditure for 2026-27 was $200.69 billion at the third estimate, 14.8% above the equivalent $174.75 billion estimate for 2025-26.
Actual equipment spending in 2025-26 was 140.0% of the third estimate for that year3. The ABS calls this comparison the realisation ratio.
| Actual and expected new capital expenditure by type of asset, private businesses, Australia, $ million, current prices, 2019-20 to 2026-27 | |||||
|---|---|---|---|---|---|
| Financial year | Equipment, plant and machinery | Buildings and structures | Total | Equipment share (%) | Equipment change (%) |
| 2019-20 | 59,172 | 68,513 | 127,685 | 46.3 | .. |
| 2020-21 | 60,344 | 65,331 | 125,676 | 48.0 | +2.0 |
| 2021-22 | 67,646 | 74,779 | 142,425 | 47.5 | +12.1 |
| 2022-23 | 77,375 | 87,730 | 165,105 | 46.9 | +14.4 |
| 2023-24 | 84,255 | 97,640 | 181,895 | 46.3 | +8.9 |
| 2024-25 | 86,151 | 102,592 | 188,743 | 45.6 | +2.3 |
| 2025-26 | 99,939 | 110,090 | 210,029 | 47.6 | +16.0 |
| 2026-27 (Estimate 3, expected) | 84,664 | 116,030 | 200,694 | 42.2 | .. |
Source · ABS, Private New Capital Expenditure and Expected Expenditure, Table 17
Section 05 · By industry
Which industries spend the most on equipment?
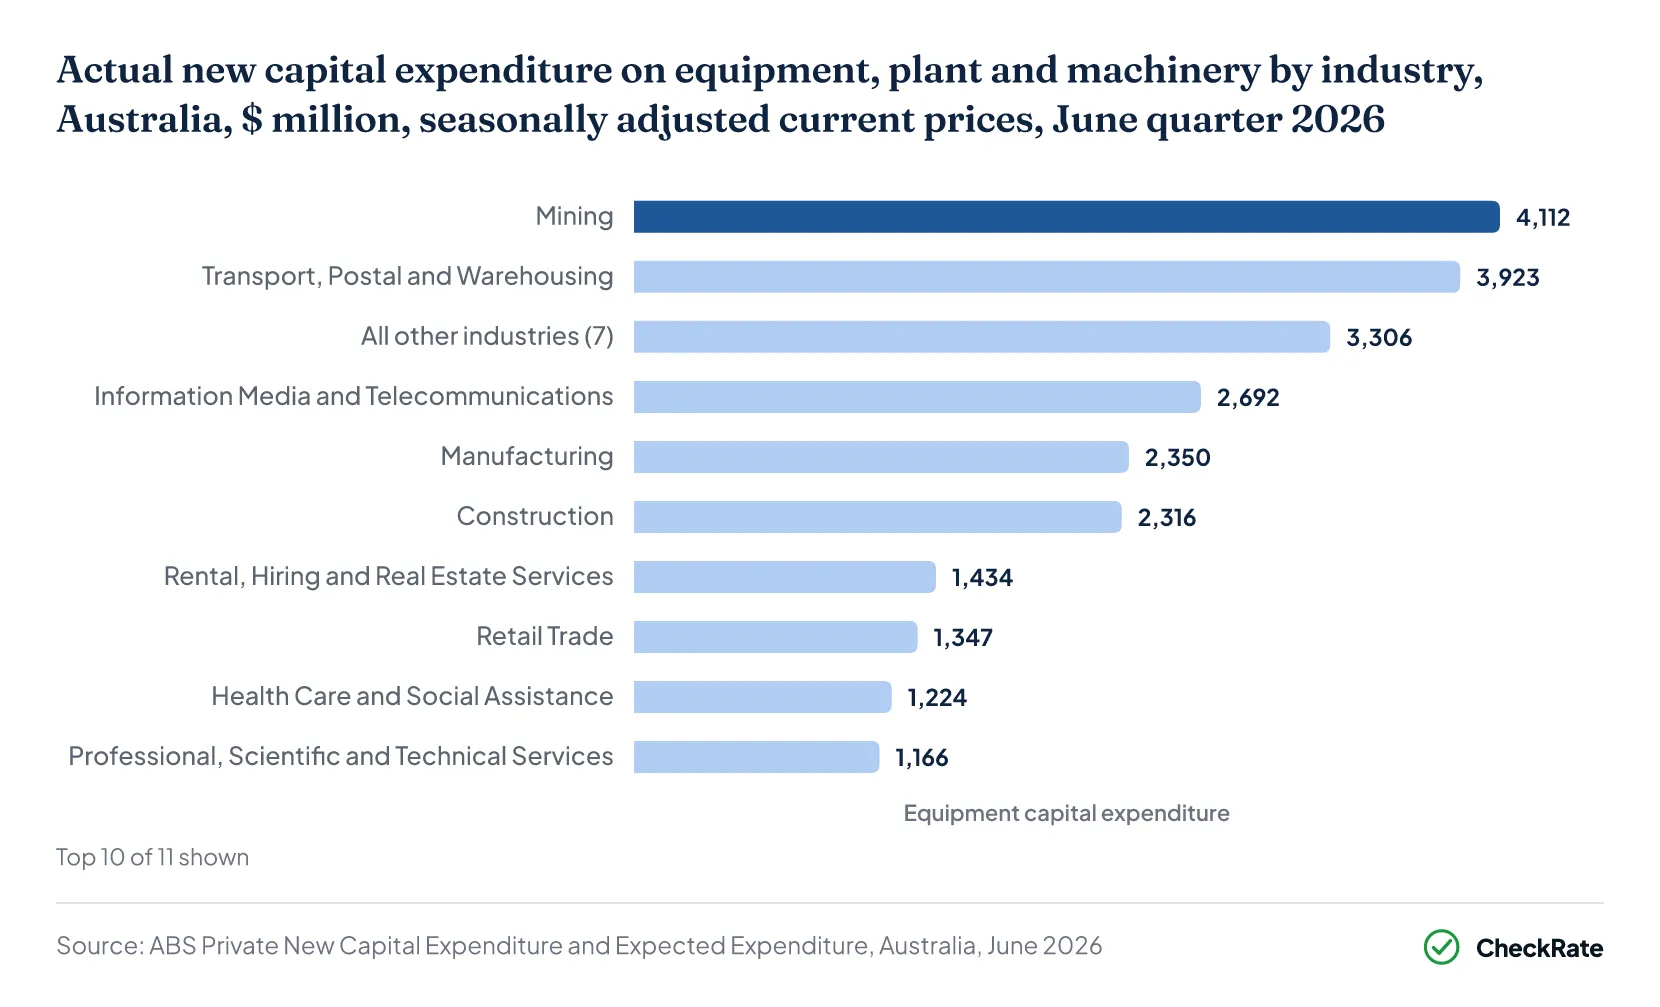
Mining had the largest equipment, plant and machinery capital expenditure of the 17 industry divisions covered by the ABS collection in the June quarter 2026, at $4.1 billion, or 16.5% of the $24.9 billion spent by private businesses3. Transport, postal and warehousing ranked second among the 17 divisions, at $3.9 billion, or 15.8%. The five largest divisions together accounted for 61.8% of equipment capital expenditure. Arts and recreation services had the smallest equipment capital expenditure, at $200 million, or 0.8%.
The industry figures are seasonally adjusted and in current prices3.
Non-mining industries spent $20.8 billion on equipment, plant and machinery in the June quarter 2026, or 83.5% of equipment capital expenditure3. Non-mining equipment capital expenditure rose 15.4%, from $18.0 billion in the June quarter 2025 to $20.8 billion in the June quarter 2026. Mining equipment capital expenditure rose 10.2%, from $3.7 billion in the June quarter 2025 to $4.1 billion in the June quarter 2026.
Information media and telecommunications recorded the fastest year-on-year growth in equipment capital expenditure of the 17 divisions, at 88.9%, from $1,425 million in the June quarter 2025 to $2,692 million in the June quarter 20263. Electricity, gas, water and waste services recorded the largest fall, down 19.5%, from $457 million in the June quarter 2025 to $368 million. Overall, nine of the 17 divisions spent more on equipment, plant and machinery than in the June quarter 2025, while eight spent less.
| Actual new capital expenditure on equipment, plant and machinery by industry, Australia, $ million, seasonally adjusted, current prices, June quarter 2026 | ||||
|---|---|---|---|---|
| Industry | June quarter 2026 | Share (%) | June quarter 2025 | Change (%) |
| Mining | 4,112 | 16.5 | 3,732 | +10.2 |
| Transport, Postal and Warehousing | 3,923 | 15.8 | 2,690 | +45.8 |
| Information Media and Telecommunications | 2,692 | 10.8 | 1,425 | +88.9 |
| Manufacturing | 2,350 | 9.4 | 2,462 | -4.5 |
| Construction | 2,316 | 9.3 | 1,792 | +29.2 |
| Rental, Hiring and Real Estate Services | 1,434 | 5.8 | 1,144 | +25.3 |
| Retail Trade | 1,347 | 5.4 | 1,585 | -15.0 |
| Health Care and Social Assistance | 1,224 | 4.9 | 1,086 | +12.7 |
| Professional, Scientific and Technical Services | 1,166 | 4.7 | 1,345 | -13.3 |
| Wholesale Trade | 1,024 | 4.1 | 984 | +4.1 |
| Financial and Insurance Services | 823 | 3.3 | 930 | -11.5 |
| Accommodation and Food Services | 768 | 3.1 | 748 | +2.7 |
| Administrative and Support Services | 440 | 1.8 | 452 | -2.7 |
| Other Services | 433 | 1.7 | 409 | +5.9 |
| Electricity, Gas, Water and Waste Services | 368 | 1.5 | 457 | -19.5 |
| Education and Training | 274 | 1.1 | 292 | -6.2 |
| Arts and Recreation Services | 200 | 0.8 | 201 | -0.5 |
| All industries | 24,894 | 100.0 | 21,733 | +14.5 |
Source · ABS, Private New Capital Expenditure and Expected Expenditure, Table 4
Section 06 · Who borrows
Which businesses seek finance to buy or replace equipment?
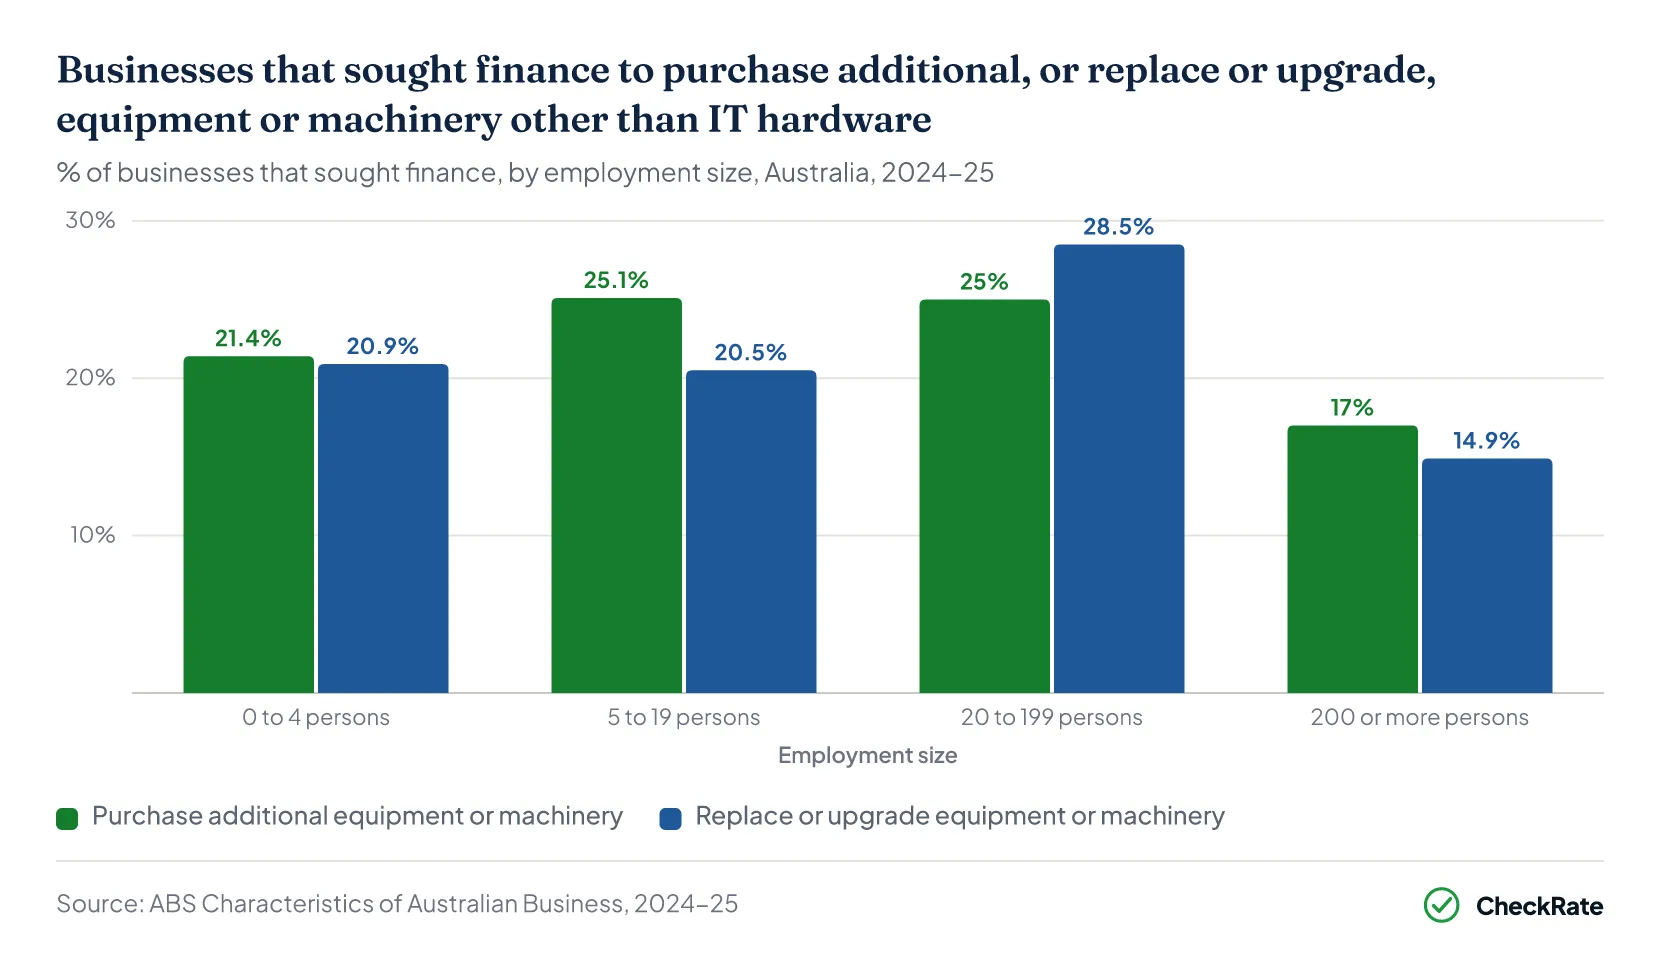
Among Australian businesses that sought debt or equity finance in 2024-25, 23.2% did so to purchase additional equipment or machinery other than IT hardware, and 21.5% did so to replace or upgrade existing equipment or machinery4. Maintaining short-term cash flow was the most common reason for seeking finance among the nine reasons reported, at 41.7% of finance seekers, followed by ensuring the survival of the business, at 37.8%.
Businesses that sought debt or equity finance in 2024-25 made up 18.3% of all Australian businesses, and 15.9% of all businesses obtained it, according to the ABS Characteristics of Australian Business survey4. The share seeking finance increased with employment size, from 13.8% of businesses with 0 to 4 persons to 35.8% of businesses with 200 or more persons.
Among finance seekers, businesses with 20 to 199 persons had the highest share seeking finance to replace or upgrade equipment or machinery, at 28.5%. Businesses with 200 or more persons recorded the lowest share, at 14.9%4. Businesses with 5 to 19 persons had the highest share seeking finance for additional equipment or machinery, at 25.1%.
Administrative and support services had the highest share of finance seekers looking to replace or upgrade equipment or machinery among the 17 industry divisions, at 42.5%, followed by electricity, gas, water and waste services, at 42.4%4.
Electricity, gas, water and waste services recorded the highest share seeking finance for additional equipment or machinery, at 38.6%, followed by transport, postal and warehousing, at 35.4%4.
Banks were the most common source of finance among businesses that sought it in 2024-25, at 54.3% of those businesses, followed by finance companies, at 41.6%4. Finance companies were used by 44.9% of finance seekers with 0 to 4 persons, compared with 27.6% of those with 200 or more persons. Banks were used by 53.4% and 64.4% of those groups, respectively. Insufficient collateral or security was reported as a barrier to accessing finance by 3.7% of all businesses, compared with 11.0% reporting uncertainty about economic conditions and 9.4% reporting insufficient sales or cash flow.
| Businesses seeking finance, reasons and sources, by employment size, Australia, %, 2024-25 | ||||||
|---|---|---|---|---|---|---|
| Employment size | Sought finance (% of businesses) | Obtained finance (% of businesses) | For additional equipment (% of seekers) | To replace or upgrade equipment (% of seekers) | From banks (% of seekers) | From finance companies (% of seekers) |
| 0 to 4 persons | 13.8 | 11.6 | 21.4 | 20.9 | 53.4 | 44.9 |
| 5 to 19 persons | 25.0 | 21.8 | 25.1 | 20.5 | 52.3 | 40.0 |
| 20 to 199 persons | 29.3 | 27.9 | 25.0 | 28.5 | 63.1 | 35.0 |
| 200 or more persons | 35.8 | 34.0 | 17.0 | 14.9 | 64.4 | 27.6 |
| All businesses | 18.3 | 15.9 | 23.2 | 21.5 | 54.3 | 41.6 |
Source · ABS, Characteristics of Australian Business, 2024-25, data cube 2, Tables 2, 3 and 4
Section 07 · Interest rates
What interest rates do Australian businesses pay on their loans?
The average interest rate on all outstanding small-business loans was 7.46% in July 2026, across all purposes and security types5. Medium businesses paid an average of 6.21% on their outstanding loans and large businesses paid 5.74%. No average rate is published for equipment finance specifically. New small-business loans funded in July 2026 had an average rate of 7.44%, with new fixed-rate loans at 8.11% and new variable-rate loans at 7.07%.
Outstanding small-business loans secured by residential property had a lower average rate, at 6.98%, compared with 7.46% for all outstanding small-business loans5. The gap was 0.48 percentage points, and the gap between the small-business and large-business average interest rates on outstanding loans was 1.72 percentage points.
The RBA reported in October 2025 that around half of small-sized loans to small and medium enterprises (SMEs) were secured with assets other than residential property, including vehicles and equipment6. The unsecured share of SME credit was less than 5% over the period analysed by the RBA.
| Average business lending rates by business size and rate type, Australia, % per annum, July 2026 | ||||||
|---|---|---|---|---|---|---|
| Business size | Outstanding, total | Outstanding, fixed-rate | Outstanding, variable-rate | New loans, total | New loans, fixed-rate | New loans, variable-rate |
| Small businesses | 7.46 | 7.58 | 7.41 | 7.44 | 8.11 | 7.07 |
| Medium businesses | 6.21 | 6.50 | 6.17 | 6.26 | 6.79 | 6.19 |
| Large businesses | 5.74 | 5.66 | 5.75 | 5.54 | 4.53 | 5.74 |
| Small businesses, residentially secured | 6.98 | .. | .. | 6.89 | .. | .. |
Source · RBA, Statistical Table F7
Rates by loan size, security and rate type, and the margin over the cash rate, are covered in the business loan interest rates article.
Section 08 · Since 2019
How has plant and equipment finance changed since 2019?
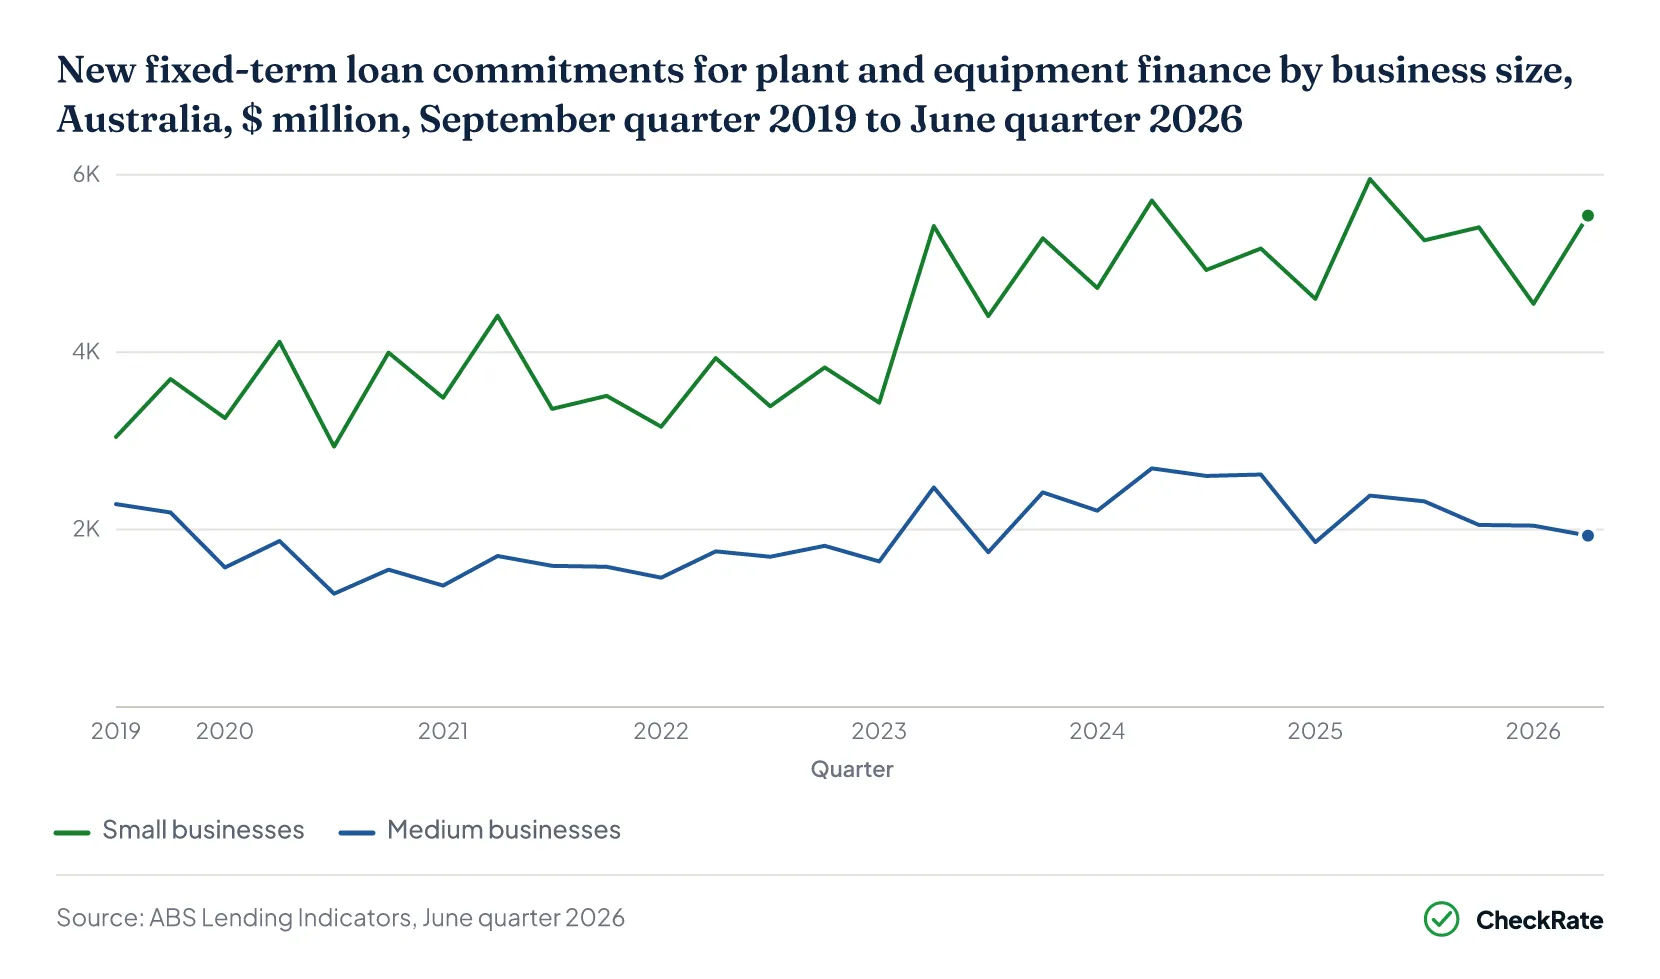
Small-business plant and equipment commitments grew from $3.04 billion in the September quarter 2019 to $5.54 billion in the June quarter 2026, an increase of 82.0%1. The ABS first reported business loan commitments by purpose for the September quarter 2019.
The June quarter 2025 had the largest small-business plant and equipment commitments over the 28 quarters from the September quarter 2019 to the June quarter 2026, at $5.95 billion. The September quarter 2020 had the smallest, at $2.94 billion1.
In each of the seven financial years from 2019-20 to 2025-26, the June quarter recorded the largest small-business plant and equipment commitments for that year1.
Medium-business plant and equipment commitments fell 15.6%, from $2.29 billion in the September quarter 2019 to $1.93 billion in the June quarter 20261. The highest quarterly figure for medium businesses was $2.69 billion in the June quarter 2024.
On a financial-year basis, small-business plant and equipment commitments rose 47.0%, from $14.12 billion in 2019-20 to $20.76 billion in 2025-261. Across all purposes excluding refinancing, small-business commitments rose 95.8%, from $29.95 billion in 2019-20 to $58.66 billion in 2025-26.
Over the same period, medium-business plant and equipment commitments rose 5.3%, from $7.92 billion in 2019-20 to $8.35 billion in 2025-261. Finance lease commitments also increased, from $10.47 billion to $14.11 billion.
Among the seven financial years, the plant and equipment share of small-business commitments was highest in 2019-20, at 47.1%, compared with 35.4% in 2025-261.
| New loan and lease commitments for plant and equipment and for all purposes by financial year, Australia, $ million, original, 2019-20 to 2025-26 | |||||||
|---|---|---|---|---|---|---|---|
| Financial year | Small businesses, plant and equipment | Small businesses, all purposes excluding refinancing | Plant and equipment share of small-business commitments (%) | Medium businesses, plant and equipment | Medium businesses, all purposes excluding refinancing | Plant and equipment share of medium-business commitments (%) | Finance leases, all purposes |
| 2019-20 | 14,115.5 | 29,954.6 | 47.1 | 7,923.7 | 56,074.1 | 14.1 | 10,471.7 |
| 2020-21 | 14,829.0 | 32,136.8 | 46.1 | 5,895.3 | 51,961.1 | 11.3 | 10,289.0 |
| 2021-22 | 13,961.5 | 37,416.0 | 37.3 | 6,383.1 | 79,526.5 | 8.0 | 9,792.9 |
| 2022-23 | 16,071.7 | 37,735.2 | 42.6 | 7,625.5 | 77,267.5 | 9.9 | 11,158.7 |
| 2023-24 | 20,126.3 | 46,519.4 | 43.3 | 9,067.0 | 88,849.4 | 10.2 | 12,747.8 |
| 2024-25 | 20,650.0 | 54,526.8 | 37.9 | 9,467.0 | 111,464.9 | 8.5 | 12,848.1 |
| 2025-26 | 20,755.4 | 58,659.6 | 35.4 | 8,345.6 | 127,771.3 | 6.5 | 14,112.7 |
Source · ABS, Lending Indicators, Tables 28, 30 and 32
Section 09
Equipment finance: quick answers
How big is the equipment finance market in Australia?
No official statistic measures the whole equipment finance market. Three Australian Bureau of Statistics measures for the June quarter 2026 add to $10.56 billion, made up of $5.54 billion of small-business fixed-term loans, $1.93 billion of medium-business fixed-term loans and $3.08 billion of finance leases for plant and equipment. This total does not include fixed-term loans to large businesses, which are not published by purpose.
What is a finance lease?
Under a finance lease, the lessee takes substantially all the risks and rewards of owning the asset, whether or not title transfers, on the Australian Bureau of Statistics definition. Businesses committed to $3.40 billion of new finance leases in original terms in the June quarter 2026, and 90.6% of the value was for plant and equipment.
Do small businesses borrow more for equipment than for property?
Yes. Small businesses committed to $5.54 billion of new fixed-term loans for plant and equipment in the June quarter 2026, compared with $5.34 billion for the purchase of property, according to the Australian Bureau of Statistics.
Which sources of finance do Australian businesses that seek finance use?
Banks were the most common source among businesses that sought finance in 2024-25, at 54.3%, followed by finance companies, at 41.6%, and the existing owners of the business, at 20.4%, according to the Australian Bureau of Statistics. Businesses could report more than one source.
What is the average interest rate on equipment finance in Australia?
No official average rate exists for equipment finance. The Reserve Bank of Australia's average rate on all outstanding small-business loans was 7.46% in July 2026, compared with 6.21% for medium businesses and 5.74% for large businesses.
How much do businesses expect to spend on equipment in 2026-27?
Businesses expected to spend $84.7 billion on equipment, plant and machinery in 2026-27 at the third estimate, reported in July and August 2026. This was 18.6% higher than the equivalent estimate for 2025-26 reported a year earlier, according to the Australian Bureau of Statistics. Actual spending in 2025-26 reached $99.9 billion, or 140.0% of that year's third estimate.
References
- ABS, Lending Indicators, June quarter 2026 · Australian Bureau of Statistics ↑ b c d e f g h i j k l m n o p q r
- ABS, Lending Indicators methodology, June quarter 2026 · Australian Bureau of Statistics ↑ b c
- ABS, Private New Capital Expenditure and Expected Expenditure, Australia, June 2026 · Australian Bureau of Statistics ↑ b c d e f g h i j k l
- ABS, Characteristics of Australian Business, 2024-25 · Australian Bureau of Statistics ↑ b c d e f g h
- RBA, Business Lending Rates: Statistical Table F7 · Reserve Bank of Australia ↑ b
- RBA Bulletin, Small Business Economic and Financial Conditions · Reserve Bank of Australia ↑
- ATO, Instant asset write-off for eligible businesses · ato.gov.au ↑